アップデート済
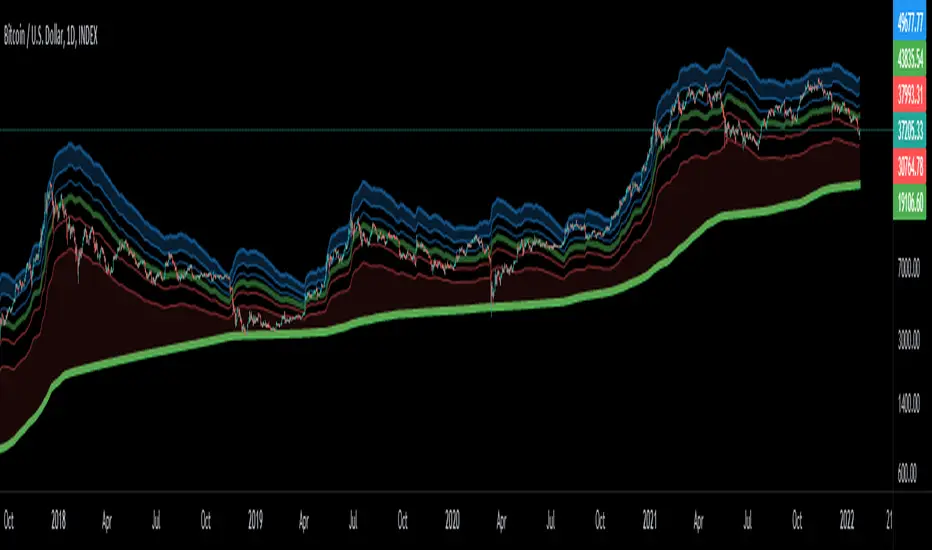
BTC Golden Bottom with Adaptive Moving Average
Introduction:
This study uses Adaptive Moving Average with 1 year of length to plot on BTCUSD all time history Index Calculated by Tradingview. All previous BTC bear runs bottomed on this curve which makes it important enough. Use this only on "BTCUSD"
Default Values:
This study uses Adaptive Moving Average with 1 year of length to plot on
BTCUSD all time history Index Calculated by Tradingview. All previous BTC bear runs bottomed on this curve which makes it important enough. Use this only on "BTCUSD"Default Values:
- AMA length is 1 year
- Minor length is 50
- Major length is 100
リリースノート
Added Envelop Bands with ATR multiples of Fibonacci levels for in depth status of present data depending on past history.リリースノート
Updated Envelope bands code with Color.rgb and applied Symmetrically Weighted Moving Average (SWMA) for Smoothness.
免責事項
これらの情報および投稿は、TradingViewが提供または承認する金融、投資、取引、またはその他の種類の助言もしくは推奨であることを意図したものではなく、またこれらに該当するものでもありません。詳細は利用規約をご覧ください。
免責事項
これらの情報および投稿は、TradingViewが提供または承認する金融、投資、取引、またはその他の種類の助言もしくは推奨であることを意図したものではなく、またこれらに該当するものでもありません。詳細は利用規約をご覧ください。