OPEN-SOURCE SCRIPT
Order Flow Delta Proxy (Tick-Rule)
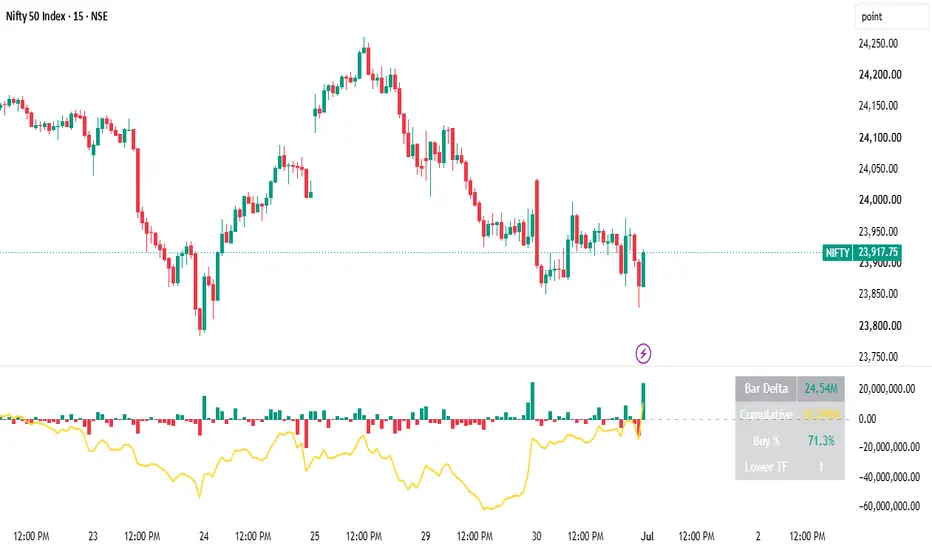
This indicator approximates buy-side versus sell-side trading pressure, commonly referred to as order flow delta or cumulative volume delta, using a tick-rule method applied to lower-timeframe price data. True bid and ask tick data is not available for most index and cash market symbols on this platform, so this script provides a volume-based directional approximation instead.
How it works:
For each bar on the chart, the script pulls a configurable lower-timeframe series of closes and volumes using request.security_lower_tf(). Each lower-timeframe close is compared to the prior lower-timeframe close: if price ticked up, that portion of volume is classified as buy-side; if price ticked down, it is classified as sell-side; unchanged ticks are split evenly, following standard tick-rule convention. These classified volumes are summed per chart bar to produce a per-bar delta value, plotted as a histogram, alongside a running cumulative delta line. If lower-timeframe data is unavailable, the script falls back to a close-position-within-range volume split as an approximation.
Notes and limitations:
This is a volume-based directional proxy, not real bid or ask order flow data. The currently forming bar's values can update intrabar as new lower-timeframe data arrives, which is expected behavior for any real-time order-flow style tool; once a bar closes, its value is fixed. This script does not generate trade signals and does not guarantee profitability. It is intended as a supplementary analytical tool and should be used alongside sound risk management. Past patterns in delta do not guarantee future price behavior.
How it works:
For each bar on the chart, the script pulls a configurable lower-timeframe series of closes and volumes using request.security_lower_tf(). Each lower-timeframe close is compared to the prior lower-timeframe close: if price ticked up, that portion of volume is classified as buy-side; if price ticked down, it is classified as sell-side; unchanged ticks are split evenly, following standard tick-rule convention. These classified volumes are summed per chart bar to produce a per-bar delta value, plotted as a histogram, alongside a running cumulative delta line. If lower-timeframe data is unavailable, the script falls back to a close-position-within-range volume split as an approximation.
Notes and limitations:
This is a volume-based directional proxy, not real bid or ask order flow data. The currently forming bar's values can update intrabar as new lower-timeframe data arrives, which is expected behavior for any real-time order-flow style tool; once a bar closes, its value is fixed. This script does not generate trade signals and does not guarantee profitability. It is intended as a supplementary analytical tool and should be used alongside sound risk management. Past patterns in delta do not guarantee future price behavior.
オープンソーススクリプト
TradingViewの精神に則り、このスクリプトの作者はコードをオープンソースとして公開してくれました。トレーダーが内容を確認・検証できるようにという配慮です。作者に拍手を送りましょう!無料で利用できますが、コードの再公開はハウスルールに従う必要があります。

免責事項
これらの情報および投稿は、TradingViewが提供または承認する金融、投資、取引、またはその他の種類の助言もしくは推奨であることを意図したものではなく、またこれらに該当するものでもありません。詳細は利用規約をご覧ください。
オープンソーススクリプト
TradingViewの精神に則り、このスクリプトの作者はコードをオープンソースとして公開してくれました。トレーダーが内容を確認・検証できるようにという配慮です。作者に拍手を送りましょう!無料で利用できますが、コードの再公開はハウスルールに従う必要があります。
免責事項
これらの情報および投稿は、TradingViewが提供または承認する金融、投資、取引、またはその他の種類の助言もしくは推奨であることを意図したものではなく、またこれらに該当するものでもありません。詳細は利用規約をご覧ください。