Normality Threshold (MTF) + Anchored VWAP
What it does:
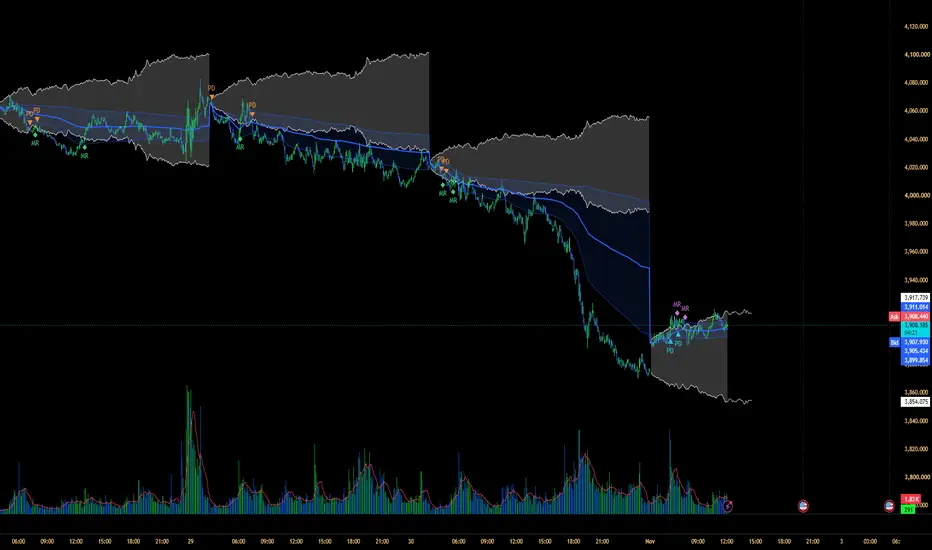
This indicator draws a “normal zone” around price for each anchor period (1H, 4H, day, week, month, and so on). The zone is built from how far price has typically moved, measured from the period open, at the same point in the period over the last N completed periods. While price stays inside the zone, movement is considered normal noise. When it leaves, something unusual is happening.
On top of that, it plots an anchored VWAP with deviation bands that reset each period, and two types of regime signals.
Signals:
PD (Price Discovery), triangle: price closes outside the zone. This suggests the market is moving into new territory, and the triangle points in the breakout direction.

MR (Mean Reversion), diamond: price closes back inside the zone after having been outside. This suggests the breakout failed and price may drift back toward the VWAP.

Signals are generated on closed bars by default and do not repaint.
How to use it:
Choose an anchor timeframe higher than your chart timeframe. “Auto” picks one for you. A 5-minute chart with a Daily anchor is a common setup.

Read PD as “price is leaving the normal range” and MR as “price is returning to it”. Use them as context alongside your own analysis, not as standalone buy or sell orders.
Use the anchored VWAP as a reference for fair value within the period.

Key settings:
Anchor Timeframe / Lookback: the period that defines the zone and how many past periods are averaged.
Width Multiplier: scales the zone wider or narrower.
Breakout / Re-entry Buffer (x ATR): the zone edge has a dead zone, so price wiggling on the line doesn’t generate signals.
Min Bars Outside / Re-entry Hold Bars: require price to commit before a signal fires.
Cooldown / Max Signals Per Side Per Period: hard limits against signal spam.
MR Requires VWAP Room: only shows an MR signal if there is still distance to the VWAP.
Marker Style: captions, transparency, background flash, and bar tint.
Notes:
Bands appear only after the script has seen Lookback completed periods. If you see nothing, load more history or reduce the lookback. A small note on the chart shows the progress.
The chart timeframe must be lower than the anchor. If it isn’t, the script falls back to Auto and tells you.
On symbols without volume data, the VWAP uses equal weighting.
Alerts are available for all four signals.
Credits:
The noise-area concept comes from Zarattini, Aziz and Barbon (2024), “Beat the Market: An Effective Intraday Momentum Strategy for S&P500 ETF (SPY)”, Concretum Research / Swiss Finance Institute Research Paper 24-97. This is an independent implementation and is not an official Concretum Research product.
Disclaimer:
This script is for educational and informational purposes only. It is not financial advice and does not guarantee any result. Past behavior does not predict future performance. Always do your own research and manage your risk.
This indicator draws a “normal zone” around price for each anchor period (1H, 4H, day, week, month, and so on). The zone is built from how far price has typically moved, measured from the period open, at the same point in the period over the last N completed periods. While price stays inside the zone, movement is considered normal noise. When it leaves, something unusual is happening.
On top of that, it plots an anchored VWAP with deviation bands that reset each period, and two types of regime signals.
Signals:
PD (Price Discovery), triangle: price closes outside the zone. This suggests the market is moving into new territory, and the triangle points in the breakout direction.
MR (Mean Reversion), diamond: price closes back inside the zone after having been outside. This suggests the breakout failed and price may drift back toward the VWAP.
Signals are generated on closed bars by default and do not repaint.
How to use it:
Choose an anchor timeframe higher than your chart timeframe. “Auto” picks one for you. A 5-minute chart with a Daily anchor is a common setup.
Read PD as “price is leaving the normal range” and MR as “price is returning to it”. Use them as context alongside your own analysis, not as standalone buy or sell orders.
Use the anchored VWAP as a reference for fair value within the period.
Key settings:
Anchor Timeframe / Lookback: the period that defines the zone and how many past periods are averaged.
Width Multiplier: scales the zone wider or narrower.
Breakout / Re-entry Buffer (x ATR): the zone edge has a dead zone, so price wiggling on the line doesn’t generate signals.
Min Bars Outside / Re-entry Hold Bars: require price to commit before a signal fires.
Cooldown / Max Signals Per Side Per Period: hard limits against signal spam.
MR Requires VWAP Room: only shows an MR signal if there is still distance to the VWAP.
Marker Style: captions, transparency, background flash, and bar tint.
Notes:
Bands appear only after the script has seen Lookback completed periods. If you see nothing, load more history or reduce the lookback. A small note on the chart shows the progress.
The chart timeframe must be lower than the anchor. If it isn’t, the script falls back to Auto and tells you.
On symbols without volume data, the VWAP uses equal weighting.
Alerts are available for all four signals.
Credits:
The noise-area concept comes from Zarattini, Aziz and Barbon (2024), “Beat the Market: An Effective Intraday Momentum Strategy for S&P500 ETF (SPY)”, Concretum Research / Swiss Finance Institute Research Paper 24-97. This is an independent implementation and is not an official Concretum Research product.
Disclaimer:
This script is for educational and informational purposes only. It is not financial advice and does not guarantee any result. Past behavior does not predict future performance. Always do your own research and manage your risk.

免責事項
これらの情報および投稿は、TradingViewが提供または承認する金融、投資、取引、またはその他の種類の助言もしくは推奨であることを意図したものではなく、またこれらに該当するものでもありません。詳細は利用規約をご覧ください。
免責事項
これらの情報および投稿は、TradingViewが提供または承認する金融、投資、取引、またはその他の種類の助言もしくは推奨であることを意図したものではなく、またこれらに該当するものでもありません。詳細は利用規約をご覧ください。