Autoregressive Neural Network (LSTM) - Predict next price/close
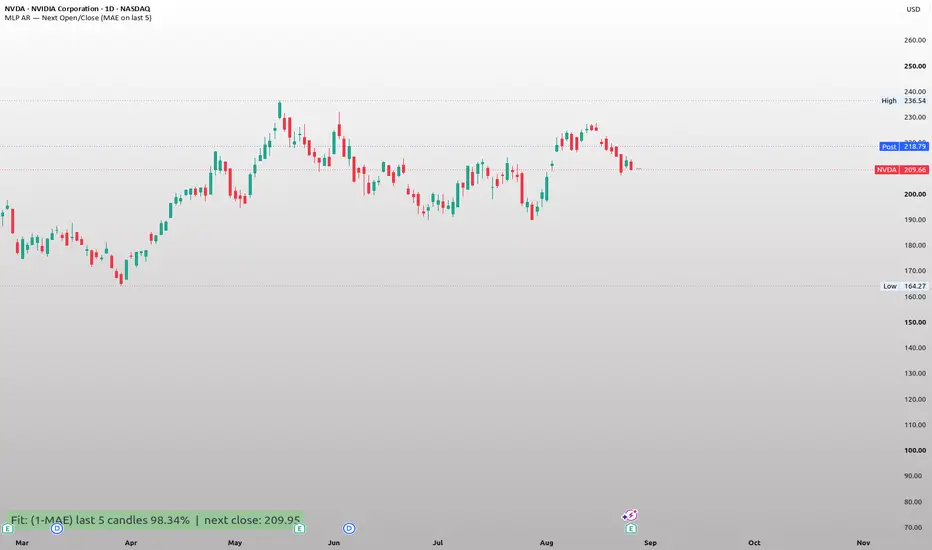
Online-trained neural network (MLP) that learns from every bar on the chart and forecasts the next bar's open and close. Written entirely in Pine Script, no external data or libraries.
═════════════════════════════════════════════
█ OVERVIEW
This indicator implements a small multilayer perceptron (MLP) in Pine Script with hand-written forward and backward passes. The network is trained incrementally as the chart plays out: on every bar it makes a prediction, compares it to what actually happened, and adjusts its weights by gradient descent. By the last bar it has learned from the entire price history available on the chart.
The output is a shaded box one bar to the right of the last candle showing the predicted open and close of the next bar, plus a strip at the bottom of the chart showing the fit quality on the most recent bars and the predicted next close.
═════════════════════════════════════════════
█ HOW IT WORKS
Inputs to the network
For each bar the network receives 2 x N features, where N is the "Window" input:
All features are divided by a rolling standard deviation of returns, so the network sees volatility-normalized values rather than raw prices. This keeps the inputs on a similar scale regardless of the instrument or the year, which matters a lot for gradient training.
Architecture
Input layer (2N) -> hidden layers -> output layer (2 neurons: next open and next close, as normalized log returns from the current close).
The number of hidden layers ("Hidden layers") and neurons per layer ("Neurons per hidden layer") are user-configurable. The activation function can be tanh, ReLU or linear. Note that with "linear" the whole network collapses to a linear autoregressive model, which is useful as a baseline but not really a neural network.
Weights are initialized with Xavier/Glorot uniform initialization from a user-chosen seed, so results are reproducible.
Training
Training is online stochastic gradient descent:
The loss is mean squared error on the two normalized outputs. Gradients are clipped to keep training stable on outlier bars.
Fit metric
After training, the network re-predicts the five most recent bars from their preceding N bars and computes the mean absolute error between predicted and actual close. The strip shows this as "Fit" = 100% - MAE%. A value of 99.2% means the predicted closes were on average 0.8% away from the actual closes.
Forecast
The trained network is fed the most recent N bars and its two outputs are converted back to price: next open = close x exp(predicted gap x volatility), next close = close x exp(predicted return x volatility). The box is green when the predicted close is above the predicted open, red otherwise.
═════════════════════════════════════════════
█ INPUTS
═════════════════════════════════════════════
█ LIMITATIONS
═════════════════════════════════════════════
█ NOTES
The code is fully open. The forward pass, backpropagation, and weight storage (flat arrays with layer offsets) are all in the script, so it can be used as a starting point for other Pine Script machine-learning experiments: adding volume or range as inputs, changing the loss, or predicting a different target such as volatility.
═════════════════════════════════════════════
█ OVERVIEW
This indicator implements a small multilayer perceptron (MLP) in Pine Script with hand-written forward and backward passes. The network is trained incrementally as the chart plays out: on every bar it makes a prediction, compares it to what actually happened, and adjusts its weights by gradient descent. By the last bar it has learned from the entire price history available on the chart.
The output is a shaded box one bar to the right of the last candle showing the predicted open and close of the next bar, plus a strip at the bottom of the chart showing the fit quality on the most recent bars and the predicted next close.
═════════════════════════════════════════════
█ HOW IT WORKS
Inputs to the network
For each bar the network receives 2 x N features, where N is the "Window" input:
- the last N close-to-close log returns
- the last N overnight gaps (log of open / previous close)
All features are divided by a rolling standard deviation of returns, so the network sees volatility-normalized values rather than raw prices. This keeps the inputs on a similar scale regardless of the instrument or the year, which matters a lot for gradient training.
Architecture
Input layer (2N) -> hidden layers -> output layer (2 neurons: next open and next close, as normalized log returns from the current close).
The number of hidden layers ("Hidden layers") and neurons per layer ("Neurons per hidden layer") are user-configurable. The activation function can be tanh, ReLU or linear. Note that with "linear" the whole network collapses to a linear autoregressive model, which is useful as a baseline but not really a neural network.
Weights are initialized with Xavier/Glorot uniform initialization from a user-chosen seed, so results are reproducible.
Training
Training is online stochastic gradient descent:
- On each historical bar the network first predicts that bar from the previous N bars, then performs one or more gradient steps ("SGD steps per bar") using the actual open and close as targets. The prediction is always made before the update, so the network never sees the bar it is predicting.
- Optionally, at the last bar the network re-trains a few extra passes ("Replay epochs") over a buffer of the most recent bars ("Replay buffer") before producing the forecast. This refines the weights toward the current regime.
The loss is mean squared error on the two normalized outputs. Gradients are clipped to keep training stable on outlier bars.
Fit metric
After training, the network re-predicts the five most recent bars from their preceding N bars and computes the mean absolute error between predicted and actual close. The strip shows this as "Fit" = 100% - MAE%. A value of 99.2% means the predicted closes were on average 0.8% away from the actual closes.
Forecast
The trained network is fed the most recent N bars and its two outputs are converted back to price: next open = close x exp(predicted gap x volatility), next close = close x exp(predicted return x volatility). The box is green when the predicted close is above the predicted open, red otherwise.
═════════════════════════════════════════════
█ INPUTS
- Window (lags N) - how many past bars feed the network.
- Neurons per hidden layer and Hidden layers - network size. Larger is not automatically better; small networks (4-16 neurons, 1-2 layers) train faster and overfit less.
- Activation - tanh (default), relu, or linear.
- Learning rate - step size of gradient descent. Too high and the weights diverge; too low and the network barely moves from its random start.
- SGD steps per bar - extra training on each bar, spread across history.
- Replay epochs at last bar and Replay buffer - extra training at the last bar only. Keep the product of these small; Pine limits how long a single loop may run.
- Vol normalization length - lookback for the volatility used to scale inputs and outputs.
- Random seed - changes the initial weights.
═════════════════════════════════════════════
█ LIMITATIONS
- The "Fit" number is an in-sample fit on bars the network has already trained on. It measures how closely the model tracks recent prices, not how well it forecasts. Because daily moves are small relative to price, this number will be high (98-99.5%) for almost any model, including "next close = current close".
- One-bar-ahead price direction is very hard to predict on liquid instruments and daily timeframes. Do not expect this, or any similar tool, to reliably call the next candle. Treat the forecast box as a model output to study, not a trade signal.
- Training is a single pass in chart order with a small number of extra steps, which is much weaker than offline training with many epochs. This is a constraint of running inside Pine Script.
- On the live bar the training step uses the partially formed candle, so the forecast will move as the current bar develops.
- Setting Replay epochs x Replay buffer too high triggers Pine's "loop takes too long" error. Reduce either value if that happens.
- The indicator does not repaint historical bars, but the forecast box is recomputed on every tick of the last bar.
═════════════════════════════════════════════
█ NOTES
The code is fully open. The forward pass, backpropagation, and weight storage (flat arrays with layer offsets) are all in the script, so it can be used as a starting point for other Pine Script machine-learning experiments: adding volume or range as inputs, changing the loss, or predicting a different target such as volatility.

免責事項
これらの情報および投稿は、TradingViewが提供または承認する金融、投資、取引、またはその他の種類の助言もしくは推奨であることを意図したものではなく、またこれらに該当するものでもありません。詳細は利用規約をご覧ください。
免責事項
これらの情報および投稿は、TradingViewが提供または承認する金融、投資、取引、またはその他の種類の助言もしくは推奨であることを意図したものではなく、またこれらに該当するものでもありません。詳細は利用規約をご覧ください。