OPEN-SOURCE SCRIPT
Advanced Support and Resistance with Reversal [AlphaPine]
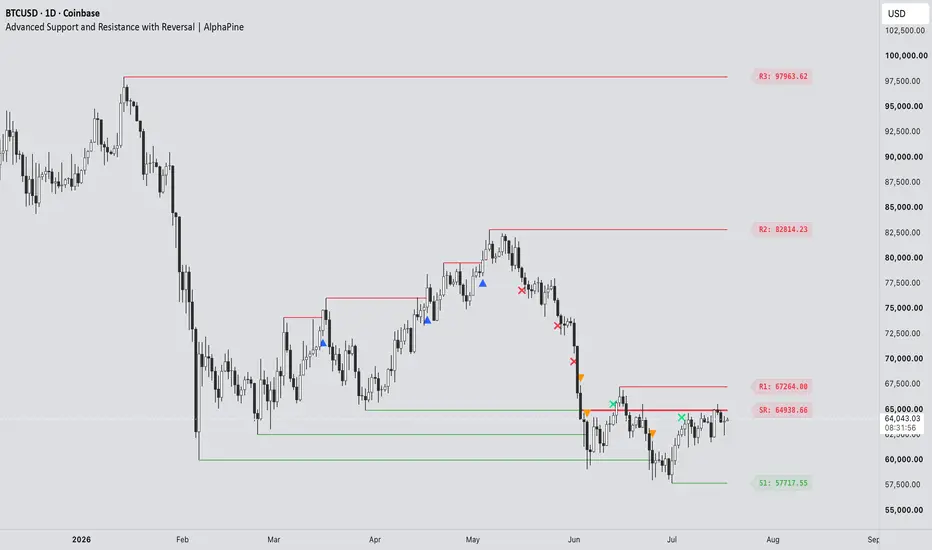
Advanced Support and Resistance with Reversal | AlphaPine
I built this indicator for a simple reason: a breakout line on its own does not tell me enough. I also want to know whether price comes back, holds the level from the other side, and later loses it again.
The script starts with confirmed swing highs and lows. Those become resistance and support. It then follows each level through three possible events: breakout, retest, and failure. Nothing here predicts the next move. It is a way to keep market structure organised without redrawing the same levels by hand.
The image below shows the full level lifecycle in one view, including the symbols that appear at each stage:

How a level is created
A resistance level comes from a confirmed pivot high. A support level comes from a confirmed pivot low. If zones are enabled, the zone uses the wick range of the pivot candle rather than an arbitrary fixed width.
Pivot confirmation takes time. With Pivot Length set to 10, for example, the script needs ten bars on the right side of the pivot before the level exists. This delay is intentional.
The merge distance uses ATR-14, so it adjusts to the instrument instead of relying on one fixed price interval.
Breakouts
The default breakout mode is Close. Resistance must close above its boundary, while support must close below it. This avoids counting every small wick through a level.
Wick mode reacts earlier. It triggers when the high or low crosses the boundary during the live candle. The recorded extreme cannot retract, but price can still close back inside the level, so Wick mode will naturally include more intrabar fakeouts.
Breakout Buffer adds an optional ATR-based distance beyond the level. Leave it at zero for the exact boundary, or raise it if very small breaks are not useful for your chart.
By default:
The marker colours are fully adjustable.
Retests and role reversals
After resistance breaks, the script waits to see whether price can retest it as support. After support breaks, it watches for the same level to act as resistance.
Reversal Confirmation controls what counts as a retest:
Once confirmed, the new role stays fixed. An RS level remains tracked as support; it does not turn red merely because the latest candle happens to sit below it.
When a flip fails
A flipped level is removed when a confirmed candle closes through the far side of its zone. In other words, RS support fails below the zone and SR resistance fails above it.
If Show Reversal Failures is enabled, an ✕ marks the failure candle. The flipped line stops there, but the cross stays on the chart as a record of where the level died. That is why a failure cross can appear without a continuing line.
Breakout triangles and failure crosses use the original pivot as their Lookback anchor. This keeps their expiry on the same structural clock as the level they came from instead of giving every marker a new lifetime from its event candle.
Reading the chart
A breakout marker is an event, not an entry instruction. I find the retest more useful than the first break, but how it is traded still depends on trend, execution, and risk rules outside this indicator.
Lines, zones, and historical placement
Historical Level Start decides where an original level begins:
Display as Zones replaces the single-price lines with the original pivot-wick range. If that level flips, the same price range is preserved; the zone is not moved to the opposite side of the price.
Colours
The Colors group separates colours by purpose, so changing a label does not force the matching line to use the same colour.
Zone fills and borders use transparent versions of the selected line colour so candles remain visible underneath.
Alerts
Seven alert conditions are included:
The combined alert is useful when one alert should cover every structural event. Separate conditions are available when different actions are needed for breaks, flips, or failures.
A sensible starting setup
The defaults use Close confirmation for both breakouts and retests. Start there if you prefer signals that wait for the candle to finish. Wick breakout and Touch retest are available when earlier, more sensitive reactions are more important.
If the chart feels crowded, try increasing Pivot Length, increasing Merge Distance, enabling the Wick Dominance Filter, or reducing Maximum Levels per Type. Settings should be adjusted for the instrument and timeframe rather than treated as universal values.
Important limitations
Use it as a structure tool, then apply your own trade plan and risk management.
I built this indicator for a simple reason: a breakout line on its own does not tell me enough. I also want to know whether price comes back, holds the level from the other side, and later loses it again.
The script starts with confirmed swing highs and lows. Those become resistance and support. It then follows each level through three possible events: breakout, retest, and failure. Nothing here predicts the next move. It is a way to keep market structure organised without redrawing the same levels by hand.
The image below shows the full level lifecycle in one view, including the symbols that appear at each stage:
How a level is created
A resistance level comes from a confirmed pivot high. A support level comes from a confirmed pivot low. If zones are enabled, the zone uses the wick range of the pivot candle rather than an arbitrary fixed width.
Pivot confirmation takes time. With Pivot Length set to 10, for example, the script needs ten bars on the right side of the pivot before the level exists. This delay is intentional.
- Pivot Length controls how selective the swing detection is. A larger value usually gives fewer levels and confirms them later.
- Lookback Period sets how long a level remains in the script's working history.
- Maximum Levels per Type limits stored resistance and support records so the chart does not keep growing indefinitely.
- Wick Dominance Filter keeps only pivot candles whose rejection wick is larger than the body and opposite wick.
- Merge Nearby Active Levels removes clutter by skipping a new pivot when an active level of the same type is already nearby. Broken levels do not block a fresh one.
The merge distance uses ATR-14, so it adjusts to the instrument instead of relying on one fixed price interval.
Breakouts
The default breakout mode is Close. Resistance must close above its boundary, while support must close below it. This avoids counting every small wick through a level.
Wick mode reacts earlier. It triggers when the high or low crosses the boundary during the live candle. The recorded extreme cannot retract, but price can still close back inside the level, so Wick mode will naturally include more intrabar fakeouts.
Breakout Buffer adds an optional ATR-based distance beyond the level. Leave it at zero for the exact boundary, or raise it if very small breaks are not useful for your chart.
By default:
- A resistance breakout prints an upward blue triangle below the candle.
- A support breakout prints a downward orange triangle above the candle.
The marker colours are fully adjustable.
Retests and role reversals
After resistance breaks, the script waits to see whether price can retest it as support. After support breaks, it watches for the same level to act as resistance.
- RS means old resistance has been confirmed as new support.
- SR means old support has been confirmed as new resistance.
Reversal Confirmation controls what counts as a retest:
- Close (default) requires the retest candle to touch the original zone and close back beyond the whole zone on the new-role side.
- Touch accepts any later overlap with the zone. It is more sensitive and less strict.
Once confirmed, the new role stays fixed. An RS level remains tracked as support; it does not turn red merely because the latest candle happens to sit below it.
When a flip fails
A flipped level is removed when a confirmed candle closes through the far side of its zone. In other words, RS support fails below the zone and SR resistance fails above it.
If Show Reversal Failures is enabled, an ✕ marks the failure candle. The flipped line stops there, but the cross stays on the chart as a record of where the level died. That is why a failure cross can appear without a continuing line.
Breakout triangles and failure crosses use the original pivot as their Lookback anchor. This keeps their expiry on the same structural clock as the level they came from instead of giving every marker a new lifetime from its event candle.
Reading the chart
- R1 is the nearest active resistance above price, followed by R2, R3, and so on.
- S1 is the nearest active support below price, followed by S2, S3, and so on.
- RS marks a confirmed resistance-to-support flip.
- SR marks a confirmed support-to-resistance flip.
- Triangles mark breakouts. Crosses mark failed flips.
A breakout marker is an event, not an entry instruction. I find the retest more useful than the first break, but how it is traded still depends on trend, execution, and risk rules outside this indicator.
Lines, zones, and historical placement
Historical Level Start decides where an original level begins:
- Confirmation (default) starts it on the bar where the pivot became known in real time.
- Pivot extends it back to the swing candle. This is useful for visual context, but the level was not available on that earlier candle.
Display as Zones replaces the single-price lines with the original pivot-wick range. If that level flips, the same price range is preserved; the zone is not moved to the opposite side of the price.
Colours
The Colors group separates colours by purpose, so changing a label does not force the matching line to use the same colour.
- Resistance and support lines/zones.
- RS and SR lines/zones.
- Resistance, support, RS, and SR price labels.
- Resistance and support breakout triangles.
- Support and resistance failure crosses.
Zone fills and borders use transparent versions of the selected line colour so candles remain visible underneath.
Alerts
Seven alert conditions are included:
- Resistance Breakout
- Support Breakout
- Resistance to Support Flip
- Support to Resistance Flip
- Flipped Support Failed
- Flipped Resistance Failed
- Any S/R Event
The combined alert is useful when one alert should cover every structural event. Separate conditions are available when different actions are needed for breaks, flips, or failures.
A sensible starting setup
The defaults use Close confirmation for both breakouts and retests. Start there if you prefer signals that wait for the candle to finish. Wick breakout and Touch retest are available when earlier, more sensitive reactions are more important.
If the chart feels crowded, try increasing Pivot Length, increasing Merge Distance, enabling the Wick Dominance Filter, or reducing Maximum Levels per Type. Settings should be adjusted for the instrument and timeframe rather than treated as universal values.
Important limitations
- Confirmed pivots always arrive late by Pivot Length bars. That is how pivot confirmation works, not a hidden predictive signal.
- Pivot historical placement back-draws a confirmed level for context. Use Confirmation placement when real-time availability matters.
- Wick mode can mark a breakout that later closes back inside the level.
- The current-bar drawings rebuild while the candle updates.
- The script uses chart data only. It does not request higher-timeframe data or use lookahead.
- It does not place orders, calculate position size, or guarantee that a level will hold.
Use it as a structure tool, then apply your own trade plan and risk management.
オープンソーススクリプト
TradingViewの精神に則り、このスクリプトの作者はコードをオープンソースとして公開してくれました。トレーダーが内容を確認・検証できるようにという配慮です。作者に拍手を送りましょう!無料で利用できますが、コードの再公開はハウスルールに従う必要があります。

Get access to AlphaPine invite-only indicators:
alphapinelab.com
Visit the website to learn how to use AlphaPine indicators.
For market research and informational purposes only. Not financial advice.
alphapinelab.com
Visit the website to learn how to use AlphaPine indicators.
For market research and informational purposes only. Not financial advice.
免責事項
これらの情報および投稿は、TradingViewが提供または承認する金融、投資、取引、またはその他の種類の助言もしくは推奨であることを意図したものではなく、またこれらに該当するものでもありません。詳細は利用規約をご覧ください。
オープンソーススクリプト
TradingViewの精神に則り、このスクリプトの作者はコードをオープンソースとして公開してくれました。トレーダーが内容を確認・検証できるようにという配慮です。作者に拍手を送りましょう!無料で利用できますが、コードの再公開はハウスルールに従う必要があります。
Get access to AlphaPine invite-only indicators:
alphapinelab.com
Visit the website to learn how to use AlphaPine indicators.
For market research and informational purposes only. Not financial advice.
alphapinelab.com
Visit the website to learn how to use AlphaPine indicators.
For market research and informational purposes only. Not financial advice.
免責事項
これらの情報および投稿は、TradingViewが提供または承認する金融、投資、取引、またはその他の種類の助言もしくは推奨であることを意図したものではなく、またこれらに該当するものでもありません。詳細は利用規約をご覧ください。