Kaste Trend MA (Bullish/Bearish)
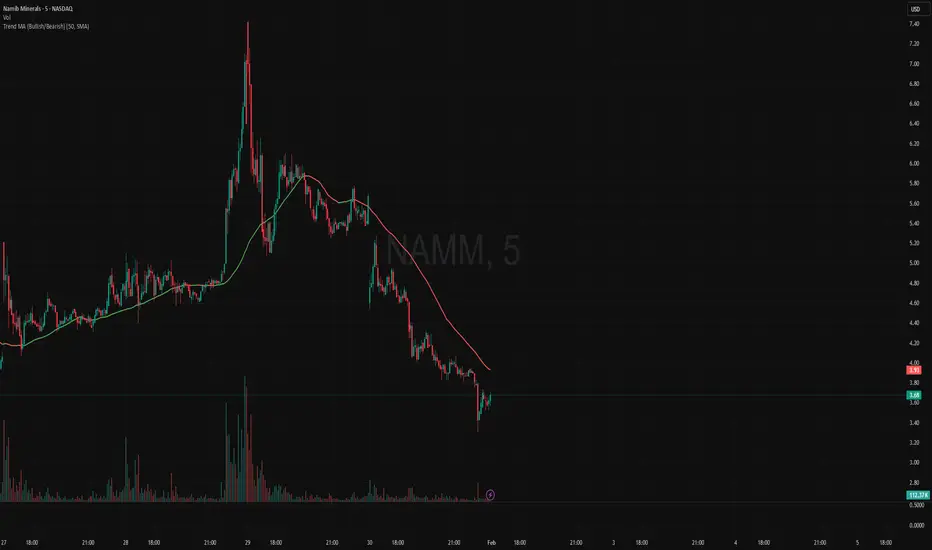
This indicator plots a moving average on top of the price chart and changes its color based on market trend direction.
When the moving average is rising, it turns green to indicate a bullish market.
When the moving average is falling, it turns red to indicate a bearish market.
The trend is determined by the slope of the moving average, making it a simple and clear visual trend indicator.
When the moving average is rising, it turns green to indicate a bullish market.
When the moving average is falling, it turns red to indicate a bearish market.
The trend is determined by the slope of the moving average, making it a simple and clear visual trend indicator.

免責事項
これらの情報および投稿は、TradingViewが提供または承認する金融、投資、取引、またはその他の種類の助言もしくは推奨であることを意図したものではなく、またこれらに該当するものでもありません。詳細は利用規約をご覧ください。
免責事項
これらの情報および投稿は、TradingViewが提供または承認する金融、投資、取引、またはその他の種類の助言もしくは推奨であることを意図したものではなく、またこれらに該当するものでもありません。詳細は利用規約をご覧ください。