PrevQtr sqrtRange -> Anchor Open Levels
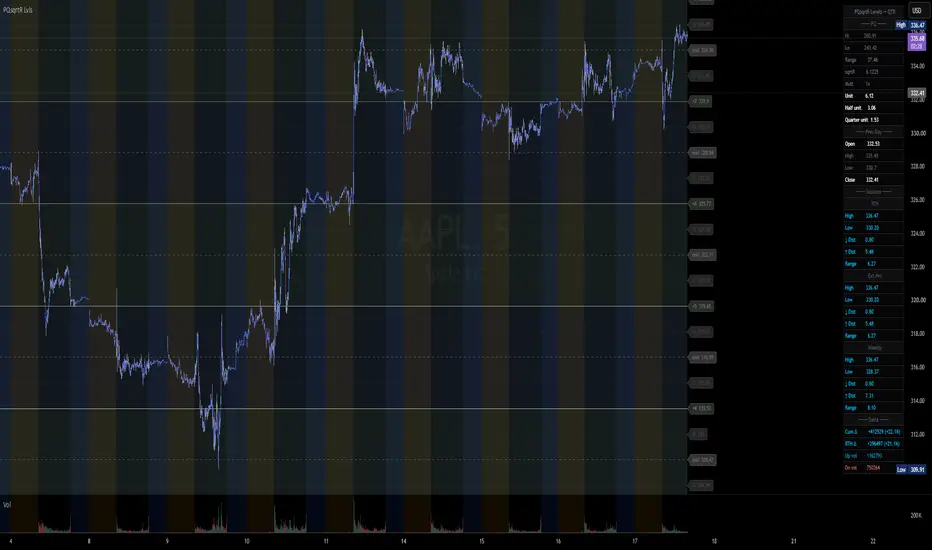
This indicator draws price levels above and below the day's (or week's) opening price, based on the previous quarter's range and the sqrt of the range.
How it works:
Pick an anchor point: today's session open, overnight open, weekly open, or quarterly open
The script measures last quarter's high-to-low range and uses that to size a "step"
It then draws lines above and below your anchor, spaced out by that step, to mark potential areas where price may react
Optional midpoint lines, shaded zones between levels, and a stats table (prior day OHLC, session ranges, volume delta)
Helps spot possible support/resistance zones; works on futures and stocks.
I typically use ETH anchor and/or the QTR open; you shouldn't just long or short the bands, as this is just a tool to have a better idea of support and resistance. I recommend backtesting before taking trades off it to see how to use it as a useful tool in reading price action.
How it works:
Pick an anchor point: today's session open, overnight open, weekly open, or quarterly open
The script measures last quarter's high-to-low range and uses that to size a "step"
It then draws lines above and below your anchor, spaced out by that step, to mark potential areas where price may react
Optional midpoint lines, shaded zones between levels, and a stats table (prior day OHLC, session ranges, volume delta)
Helps spot possible support/resistance zones; works on futures and stocks.
I typically use ETH anchor and/or the QTR open; you shouldn't just long or short the bands, as this is just a tool to have a better idea of support and resistance. I recommend backtesting before taking trades off it to see how to use it as a useful tool in reading price action.

免責事項
これらの情報および投稿は、TradingViewが提供または承認する金融、投資、取引、またはその他の種類の助言もしくは推奨であることを意図したものではなく、またこれらに該当するものでもありません。詳細は利用規約をご覧ください。
免責事項
これらの情報および投稿は、TradingViewが提供または承認する金融、投資、取引、またはその他の種類の助言もしくは推奨であることを意図したものではなく、またこれらに該当するものでもありません。詳細は利用規約をご覧ください。