Session Time-at-Price Profile
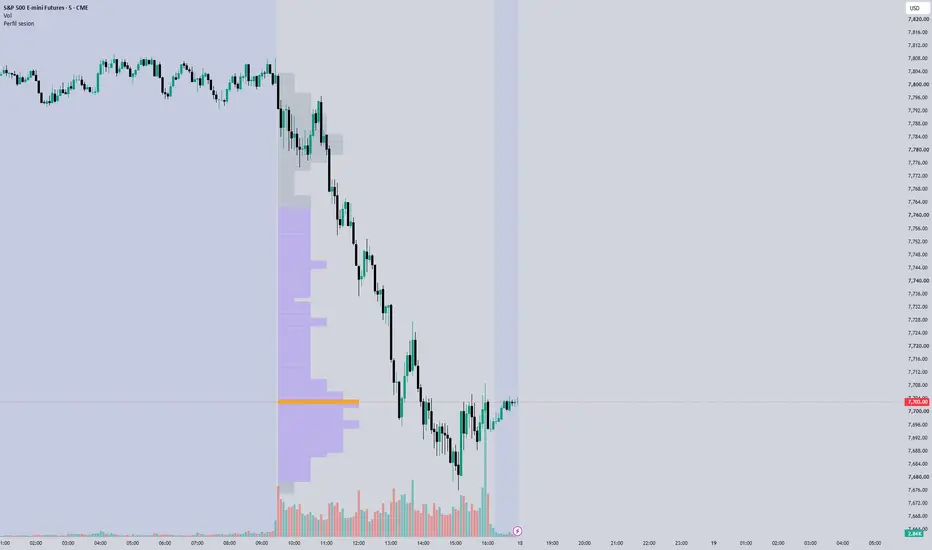
A light time-at-price profile of the regular session, computed on the data of the chart you open it on: the session in progress and the one before it (or the last two when the market is closed).
HOW IT IS BUILT
- Each 30-minute period that traded at a price row adds one block to that row, so the length of a row is the number of periods that traded there.
- Point of control (POC): the row with the most periods. Ties go to the row closest to the middle of the range, then to the higher one.
- Value area: 70% of the blocks, grown from the POC one row at a time.
- Row size: a round number of ticks that gives about 45 rows for a typical session of that market, or a fixed size you choose.
- Optional period letters (A = first 30 minutes).
SESSIONS
The session window follows each market's own day session in New York time (for example 09:30-16:00 for equity index futures, 08:20-13:30 for gold), or a window you set by hand. On charts whose timeframe does not line up with the session and the 30-minute periods, it reads intrabars so the profile is the same on any timeframe.
WHAT IT IS NOT
It is a drawing of structure, not a signal, and it does not suggest trades. The profile of the session in progress changes until the session ends; the profile of a finished session does not change.
Labels and settings are in Spanish.
HOW IT IS BUILT
- Each 30-minute period that traded at a price row adds one block to that row, so the length of a row is the number of periods that traded there.
- Point of control (POC): the row with the most periods. Ties go to the row closest to the middle of the range, then to the higher one.
- Value area: 70% of the blocks, grown from the POC one row at a time.
- Row size: a round number of ticks that gives about 45 rows for a typical session of that market, or a fixed size you choose.
- Optional period letters (A = first 30 minutes).
SESSIONS
The session window follows each market's own day session in New York time (for example 09:30-16:00 for equity index futures, 08:20-13:30 for gold), or a window you set by hand. On charts whose timeframe does not line up with the session and the 30-minute periods, it reads intrabars so the profile is the same on any timeframe.
WHAT IT IS NOT
It is a drawing of structure, not a signal, and it does not suggest trades. The profile of the session in progress changes until the session ends; the profile of a finished session does not change.
Labels and settings are in Spanish.

Perfiltrade — futures analysis with the sample in plain sight: historical base rates, Market Profile and COT across 30 instruments. No signals, no black boxes. perfiltrade.com
免責事項
これらの情報および投稿は、TradingViewが提供または承認する金融、投資、取引、またはその他の種類の助言もしくは推奨であることを意図したものではなく、またこれらに該当するものでもありません。詳細は利用規約をご覧ください。
Perfiltrade — futures analysis with the sample in plain sight: historical base rates, Market Profile and COT across 30 instruments. No signals, no black boxes. perfiltrade.com
免責事項
これらの情報および投稿は、TradingViewが提供または承認する金融、投資、取引、またはその他の種類の助言もしくは推奨であることを意図したものではなく、またこれらに該当するものでもありません。詳細は利用規約をご覧ください。