アップデート済
DW-MTF-Close Price(1W/3D) as Support Line
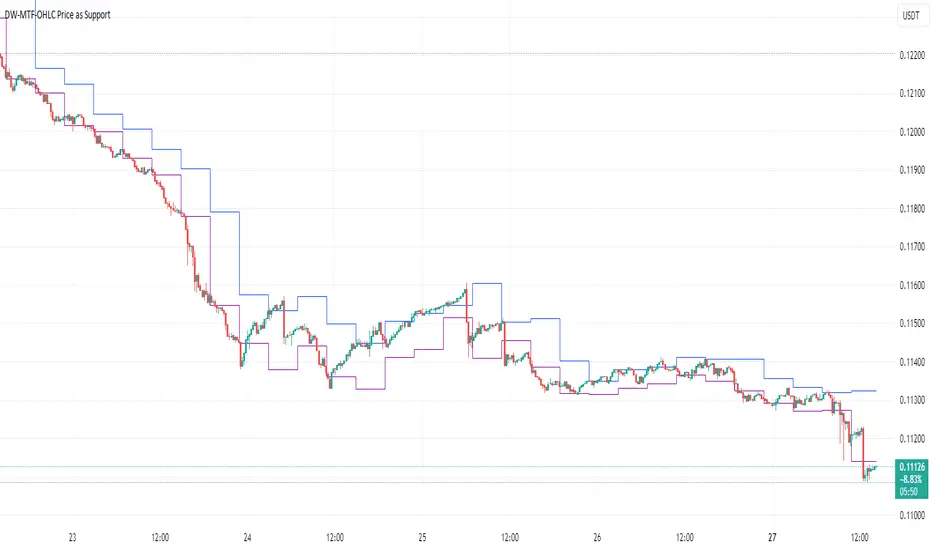
This simple study shows closing price of [up to 2] higher timeframes on your chart. Be sure to use a lower timeframe on your chart itself.
リリースノート
Repainting Removedリリースノート
Updated according to rules (RSI's removed). Code cleaned up.リリースノート
This Indicator has been enhanced.In the past, only Close price could used for the 2 support lines. With this update it is possible to select source - Open, High, Low, Close etc. This is especially useful for tracking price movements on e.g. 15m within 4h low and high support lines.
Example 1:
Support line 1 - 1 DAY close
Support line 2 - 3 DAY close
2 support lines for buying and selling above/below.
Example 2:
Support line 1 - 4h LOW
Support line 2 - 4H HIGH
If your current timeframe on chart is 15m, track the prices changes within the LOW/HIGH of 4h
リリースノート
Default colors changed to blue and purple 
免責事項
これらの情報および投稿は、TradingViewが提供または承認する金融、投資、取引、またはその他の種類の助言もしくは推奨であることを意図したものではなく、またこれらに該当するものでもありません。詳細は利用規約をご覧ください。
免責事項
これらの情報および投稿は、TradingViewが提供または承認する金融、投資、取引、またはその他の種類の助言もしくは推奨であることを意図したものではなく、またこれらに該当するものでもありません。詳細は利用規約をご覧ください。