OPEN-SOURCE SCRIPT
Advance Machine Learning and SMC Data Analyist
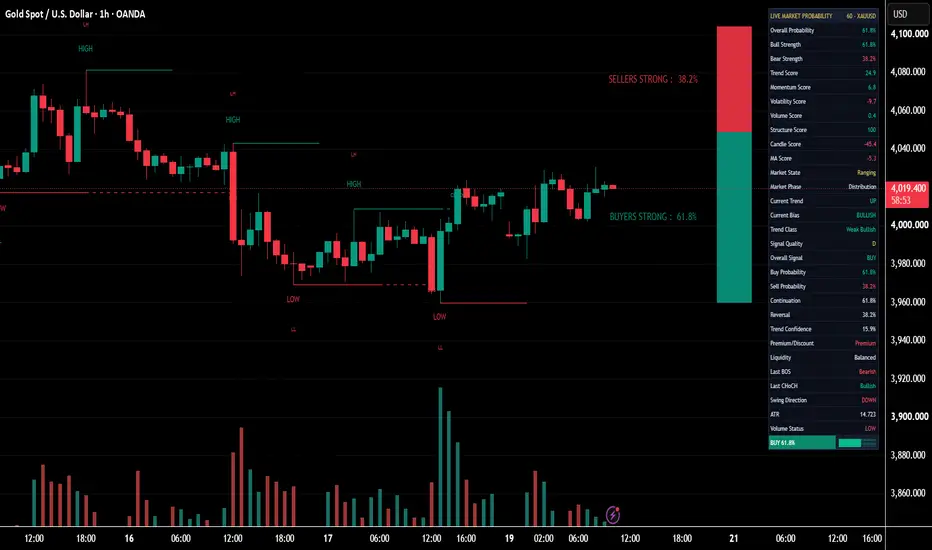
Advance Machine Learning and SMC Data Analyist
tradingview.com/u/Forex_Market_Insights/
Advance Machine Learning and SMC Data Analyist is a comprehensive market intelligence indicator developed to help traders understand the real-time condition of the financial markets through a combination of trend analysis, Smart Money Concepts (SMC), market structure evaluation, probability modeling, momentum analysis, and volume confirmation.
Rather than relying on a single technical indicator or a simple moving average crossover, this indicator combines multiple market factors into one unified analytical framework. The objective is to provide traders with a clearer understanding of who currently controls the market, how strong that control is, where important market structure levels are located, and whether current price action is supported by momentum and volume.
The indicator is designed to function as an all-in-one decision-support tool that continuously analyzes live market data and presents the results in a professional, easy-to-read visual format. Instead of forcing traders to interpret multiple separate indicators, everything is consolidated into a single system that updates dynamically as new candles form.
Why This Indicator Was Created
Financial markets are influenced by multiple interacting factors, including trend direction, liquidity, momentum, volatility, volume participation, and market structure. Most traditional indicators only evaluate one of these variables independently, requiring traders to combine several tools manually to build an overall market view.
Advance Machine Learning and SMC Data Analyist was created to simplify this process by bringing several important analytical components together into one indicator. Its purpose is to reduce chart clutter while providing a structured overview of current market conditions.
The indicator is intended to help traders:
Understand the dominant market direction.
Measure the relative strength of buyers and sellers.
Identify significant swing highs and swing lows.
Evaluate market structure changes.
Confirm trends with volume.
Assess the probability of continuation or reversal.
Improve trade confidence through multiple layers of market confirmation.
Rather than predicting the future, the indicator is designed to continuously interpret available market data and present it in an organized, visually accessible manner.
How the Indicator Works
The indicator continuously analyzes live price action as every new candle is completed. Multiple internal calculations are performed simultaneously to evaluate different aspects of the market.
These include:
Price action
Market structure
Swing analysis
Trend direction
Candle characteristics
Momentum
Relative strength
Volatility
Volume behavior
Market pressure
Each analytical component contributes to an internal scoring process that estimates the current state of the market.
Instead of producing isolated signals, the indicator combines these observations into an integrated market assessment that updates in real time.
Market Structure Analysis
The indicator automatically identifies significant market structure points throughout the chart.
These include:
Swing Highs
Swing Lows
Higher Highs (HH)
Higher Lows (HL)
Lower Highs (LH)
Lower Lows (LL)
These structural points help traders visualize how price is evolving over time and whether the market is maintaining a bullish or bearish sequence.
Monitoring these levels assists in recognizing trend continuation, potential reversals, and changes in market behavior.
Smart Money Concepts (SMC)
The indicator incorporates Smart Money Concepts as part of its market analysis framework.
Its objective is to improve understanding of institutional market behavior through structural interpretation rather than relying solely on conventional indicators.
The analytical engine evaluates important structural relationships that can assist traders in identifying:
Trend continuation
Structural shifts
Directional bias
Potential areas of institutional interest
Overall market context
These components work together with the remaining analytical modules to produce a more complete market assessment.
Buyer vs Seller Strength Analysis
One of the primary visual features of the indicator is the live Buyer vs Seller Strength meter.
This continuously compares bullish and bearish market participation using internally calculated market pressure metrics.
The vertical strength bar updates dynamically throughout market activity.
When buying pressure increases:
The green portion expands.
Buyer strength percentage rises.
When selling pressure becomes dominant:
The red portion increases.
Seller strength percentage rises.
The percentages displayed beside the bar provide an immediate visual representation of which side currently has greater influence.
Because these values update continuously with incoming market data, traders can quickly recognize shifts in market control.
Trend Analysis
The indicator continuously evaluates overall market direction.
Depending on current market conditions, it classifies the market into directional states such as:
Bullish
Bearish
Trending
Ranging
Trend assessment is based on multiple analytical inputs rather than a single moving average or oscillator, helping provide a broader perspective of market conditions.
Volume Analysis
The lower panel contains a dynamic volume histogram that provides additional confirmation of market activity.
Bullish volume bars are displayed in green.
Bearish volume bars are displayed in red.
The histogram allows traders to compare price movement with market participation, helping determine whether current price action is supported by increasing or decreasing trading activity.
Higher volume during directional movement may indicate stronger market participation, while weaker volume may suggest reduced conviction.
Probability Engine
The indicator includes an internal probability model that continuously estimates the current balance between bullish and bearish market conditions.
Several probability values are displayed inside the dashboard, including:
Overall Probability
Buy Probability
Sell Probability
Trend Confidence
Continuation Probability
Reversal Probability
These values are generated from the combined analysis of multiple market factors and are intended to provide a statistical representation of current market conditions rather than guaranteed predictions.
Live Dashboard
A professional dashboard positioned in the upper-right corner summarizes the complete market analysis.
Instead of requiring traders to interpret every visual element individually, the dashboard consolidates important analytical information into a single interface.
Depending on market conditions, the dashboard may display information such as:
Overall Probability
Bull Strength
Bear Strength
Trend Score
Momentum Score
Volatility Score
Volume Score
Structure Score
Candle Score
Moving Average Score
Market State
Market Phase
Current Trend
Current Bias
Trend Class
Signal Quality
Overall Signal
Buy Probability
Sell Probability
Continuation Probability
Reversal Probability
Trend Confidence
Premium / Discount
Liquidity Status
Last Break of Structure
Last Change of Character
Swing Direction
ATR
Volume Status
Every value updates automatically as market conditions change.
Live Market Adaptation
The indicator has been designed to continuously adapt to live market conditions.
No fixed market assumptions are used.
As new candles form:
Trend calculations update.
Structure analysis refreshes.
Buyer and seller strength changes.
Volume statistics recalculate.
Dashboard values adjust.
Market probabilities evolve.
This allows the indicator to remain responsive to changing market environments rather than relying on static historical measurements.
Multi-Timeframe Compatibility
Advance Machine Learning and SMC Data Analyist is designed to operate across multiple chart intervals.
The internal calculations automatically adapt to the active timeframe, allowing the indicator to be used on:
1 Minute
3 Minute
5 Minute
15 Minute
30 Minute
1 Hour
4 Hour
Daily
Weekly
Monthly
The analytical output is recalculated according to the selected timeframe without requiring separate versions of the indicator.
Supported Markets
The indicator has been developed for use across a wide range of financial instruments, including:
Forex
Cryptocurrencies
Stocks
Commodities
Indices
Futures
Its adaptive analytical framework allows it to respond to different market characteristics while maintaining a consistent user experience.
Intended Purpose
Advance Machine Learning and SMC Data Analyist was created as an advanced market analysis tool designed to help traders organize complex market information into a structured decision-making process.
It is intended to improve market awareness by combining multiple analytical perspectives within a single indicator rather than requiring numerous separate tools.
The indicator should be viewed as an aid for market analysis and trade planning. Like all technical analysis tools, it should be used alongside sound risk management, proper position sizing, and independent trading judgment.
Verification & Clarification
Developer Verification
Developer: Forex_Market_Insights
This indicator has been independently researched, designed, engineered, and programmed exclusively by Forex_Market_Insights. Every component of the script—including its analytical framework, market structure engine, Smart Money Concepts implementation, probability scoring model, buyer and seller strength calculations, volume analytics, dashboard system, visualization design, user interface, alert architecture, and internal workflow—has been created as part of an original development process.
The source code has been written specifically for this project and is not copied, cloned, reverse-engineered, decompiled, translated, or lightly modified from any existing TradingView indicator, commercial software, open-source Pine Script, GitHub repository, website, or third-party product.
The concepts used within this indicator—such as trend analysis, Smart Money Concepts (SMC), market structure, probability scoring, momentum evaluation, volatility analysis, and volume interpretation—are well-established principles within technical analysis. However, the methods used to calculate, combine, visualize, and present these concepts represent an original implementation developed specifically by Forex_Market_Insights.
The reference image used during development served only as a visual design example to illustrate the preferred layout and user interface. It was not used as a source for copying algorithms, calculations, program logic, or source code. All mathematical models, functions, visualization techniques, scoring systems, dashboard architecture, and implementation details were independently designed and programmed from scratch.
This indicator has been published to provide traders with a comprehensive market analysis solution that integrates multiple analytical perspectives into a single, organized interface. It is intended to assist traders in understanding evolving market conditions while complying with TradingView's House Rules, originality standards, and intellectual property requirements.
tradingview.com/u/Forex_Market_Insights/
tradingview.com/u/Forex_Market_Insights/
Advance Machine Learning and SMC Data Analyist is a comprehensive market intelligence indicator developed to help traders understand the real-time condition of the financial markets through a combination of trend analysis, Smart Money Concepts (SMC), market structure evaluation, probability modeling, momentum analysis, and volume confirmation.
Rather than relying on a single technical indicator or a simple moving average crossover, this indicator combines multiple market factors into one unified analytical framework. The objective is to provide traders with a clearer understanding of who currently controls the market, how strong that control is, where important market structure levels are located, and whether current price action is supported by momentum and volume.
The indicator is designed to function as an all-in-one decision-support tool that continuously analyzes live market data and presents the results in a professional, easy-to-read visual format. Instead of forcing traders to interpret multiple separate indicators, everything is consolidated into a single system that updates dynamically as new candles form.
Why This Indicator Was Created
Financial markets are influenced by multiple interacting factors, including trend direction, liquidity, momentum, volatility, volume participation, and market structure. Most traditional indicators only evaluate one of these variables independently, requiring traders to combine several tools manually to build an overall market view.
Advance Machine Learning and SMC Data Analyist was created to simplify this process by bringing several important analytical components together into one indicator. Its purpose is to reduce chart clutter while providing a structured overview of current market conditions.
The indicator is intended to help traders:
Understand the dominant market direction.
Measure the relative strength of buyers and sellers.
Identify significant swing highs and swing lows.
Evaluate market structure changes.
Confirm trends with volume.
Assess the probability of continuation or reversal.
Improve trade confidence through multiple layers of market confirmation.
Rather than predicting the future, the indicator is designed to continuously interpret available market data and present it in an organized, visually accessible manner.
How the Indicator Works
The indicator continuously analyzes live price action as every new candle is completed. Multiple internal calculations are performed simultaneously to evaluate different aspects of the market.
These include:
Price action
Market structure
Swing analysis
Trend direction
Candle characteristics
Momentum
Relative strength
Volatility
Volume behavior
Market pressure
Each analytical component contributes to an internal scoring process that estimates the current state of the market.
Instead of producing isolated signals, the indicator combines these observations into an integrated market assessment that updates in real time.
Market Structure Analysis
The indicator automatically identifies significant market structure points throughout the chart.
These include:
Swing Highs
Swing Lows
Higher Highs (HH)
Higher Lows (HL)
Lower Highs (LH)
Lower Lows (LL)
These structural points help traders visualize how price is evolving over time and whether the market is maintaining a bullish or bearish sequence.
Monitoring these levels assists in recognizing trend continuation, potential reversals, and changes in market behavior.
Smart Money Concepts (SMC)
The indicator incorporates Smart Money Concepts as part of its market analysis framework.
Its objective is to improve understanding of institutional market behavior through structural interpretation rather than relying solely on conventional indicators.
The analytical engine evaluates important structural relationships that can assist traders in identifying:
Trend continuation
Structural shifts
Directional bias
Potential areas of institutional interest
Overall market context
These components work together with the remaining analytical modules to produce a more complete market assessment.
Buyer vs Seller Strength Analysis
One of the primary visual features of the indicator is the live Buyer vs Seller Strength meter.
This continuously compares bullish and bearish market participation using internally calculated market pressure metrics.
The vertical strength bar updates dynamically throughout market activity.
When buying pressure increases:
The green portion expands.
Buyer strength percentage rises.
When selling pressure becomes dominant:
The red portion increases.
Seller strength percentage rises.
The percentages displayed beside the bar provide an immediate visual representation of which side currently has greater influence.
Because these values update continuously with incoming market data, traders can quickly recognize shifts in market control.
Trend Analysis
The indicator continuously evaluates overall market direction.
Depending on current market conditions, it classifies the market into directional states such as:
Bullish
Bearish
Trending
Ranging
Trend assessment is based on multiple analytical inputs rather than a single moving average or oscillator, helping provide a broader perspective of market conditions.
Volume Analysis
The lower panel contains a dynamic volume histogram that provides additional confirmation of market activity.
Bullish volume bars are displayed in green.
Bearish volume bars are displayed in red.
The histogram allows traders to compare price movement with market participation, helping determine whether current price action is supported by increasing or decreasing trading activity.
Higher volume during directional movement may indicate stronger market participation, while weaker volume may suggest reduced conviction.
Probability Engine
The indicator includes an internal probability model that continuously estimates the current balance between bullish and bearish market conditions.
Several probability values are displayed inside the dashboard, including:
Overall Probability
Buy Probability
Sell Probability
Trend Confidence
Continuation Probability
Reversal Probability
These values are generated from the combined analysis of multiple market factors and are intended to provide a statistical representation of current market conditions rather than guaranteed predictions.
Live Dashboard
A professional dashboard positioned in the upper-right corner summarizes the complete market analysis.
Instead of requiring traders to interpret every visual element individually, the dashboard consolidates important analytical information into a single interface.
Depending on market conditions, the dashboard may display information such as:
Overall Probability
Bull Strength
Bear Strength
Trend Score
Momentum Score
Volatility Score
Volume Score
Structure Score
Candle Score
Moving Average Score
Market State
Market Phase
Current Trend
Current Bias
Trend Class
Signal Quality
Overall Signal
Buy Probability
Sell Probability
Continuation Probability
Reversal Probability
Trend Confidence
Premium / Discount
Liquidity Status
Last Break of Structure
Last Change of Character
Swing Direction
ATR
Volume Status
Every value updates automatically as market conditions change.
Live Market Adaptation
The indicator has been designed to continuously adapt to live market conditions.
No fixed market assumptions are used.
As new candles form:
Trend calculations update.
Structure analysis refreshes.
Buyer and seller strength changes.
Volume statistics recalculate.
Dashboard values adjust.
Market probabilities evolve.
This allows the indicator to remain responsive to changing market environments rather than relying on static historical measurements.
Multi-Timeframe Compatibility
Advance Machine Learning and SMC Data Analyist is designed to operate across multiple chart intervals.
The internal calculations automatically adapt to the active timeframe, allowing the indicator to be used on:
1 Minute
3 Minute
5 Minute
15 Minute
30 Minute
1 Hour
4 Hour
Daily
Weekly
Monthly
The analytical output is recalculated according to the selected timeframe without requiring separate versions of the indicator.
Supported Markets
The indicator has been developed for use across a wide range of financial instruments, including:
Forex
Cryptocurrencies
Stocks
Commodities
Indices
Futures
Its adaptive analytical framework allows it to respond to different market characteristics while maintaining a consistent user experience.
Intended Purpose
Advance Machine Learning and SMC Data Analyist was created as an advanced market analysis tool designed to help traders organize complex market information into a structured decision-making process.
It is intended to improve market awareness by combining multiple analytical perspectives within a single indicator rather than requiring numerous separate tools.
The indicator should be viewed as an aid for market analysis and trade planning. Like all technical analysis tools, it should be used alongside sound risk management, proper position sizing, and independent trading judgment.
Verification & Clarification
Developer Verification
Developer: Forex_Market_Insights
This indicator has been independently researched, designed, engineered, and programmed exclusively by Forex_Market_Insights. Every component of the script—including its analytical framework, market structure engine, Smart Money Concepts implementation, probability scoring model, buyer and seller strength calculations, volume analytics, dashboard system, visualization design, user interface, alert architecture, and internal workflow—has been created as part of an original development process.
The source code has been written specifically for this project and is not copied, cloned, reverse-engineered, decompiled, translated, or lightly modified from any existing TradingView indicator, commercial software, open-source Pine Script, GitHub repository, website, or third-party product.
The concepts used within this indicator—such as trend analysis, Smart Money Concepts (SMC), market structure, probability scoring, momentum evaluation, volatility analysis, and volume interpretation—are well-established principles within technical analysis. However, the methods used to calculate, combine, visualize, and present these concepts represent an original implementation developed specifically by Forex_Market_Insights.
The reference image used during development served only as a visual design example to illustrate the preferred layout and user interface. It was not used as a source for copying algorithms, calculations, program logic, or source code. All mathematical models, functions, visualization techniques, scoring systems, dashboard architecture, and implementation details were independently designed and programmed from scratch.
This indicator has been published to provide traders with a comprehensive market analysis solution that integrates multiple analytical perspectives into a single, organized interface. It is intended to assist traders in understanding evolving market conditions while complying with TradingView's House Rules, originality standards, and intellectual property requirements.
tradingview.com/u/Forex_Market_Insights/
オープンソーススクリプト
TradingViewの精神に則り、このスクリプトの作者はコードをオープンソースとして公開してくれました。トレーダーが内容を確認・検証できるようにという配慮です。作者に拍手を送りましょう!無料で利用できますが、コードの再公開はハウスルールに従う必要があります。

Join My VIP Free Signals Channel.✅
telegram.me/+ZNhfjlhXP3s4OWI1
For Daily LIVE Trades,
Join Free Telegram Channel ✅
telegram.me/+ZNhfjlhXP3s4OWI1
telegram.me/+ZNhfjlhXP3s4OWI1
For Daily LIVE Trades,
Join Free Telegram Channel ✅
telegram.me/+ZNhfjlhXP3s4OWI1
免責事項
これらの情報および投稿は、TradingViewが提供または承認する金融、投資、取引、またはその他の種類の助言もしくは推奨であることを意図したものではなく、またこれらに該当するものでもありません。詳細は利用規約をご覧ください。
オープンソーススクリプト
TradingViewの精神に則り、このスクリプトの作者はコードをオープンソースとして公開してくれました。トレーダーが内容を確認・検証できるようにという配慮です。作者に拍手を送りましょう!無料で利用できますが、コードの再公開はハウスルールに従う必要があります。
Join My VIP Free Signals Channel.✅
telegram.me/+ZNhfjlhXP3s4OWI1
For Daily LIVE Trades,
Join Free Telegram Channel ✅
telegram.me/+ZNhfjlhXP3s4OWI1
telegram.me/+ZNhfjlhXP3s4OWI1
For Daily LIVE Trades,
Join Free Telegram Channel ✅
telegram.me/+ZNhfjlhXP3s4OWI1
免責事項
これらの情報および投稿は、TradingViewが提供または承認する金融、投資、取引、またはその他の種類の助言もしくは推奨であることを意図したものではなく、またこれらに該当するものでもありません。詳細は利用規約をご覧ください。