OPEN-SOURCE SCRIPT
Elder's Thermometer (ETHERM)
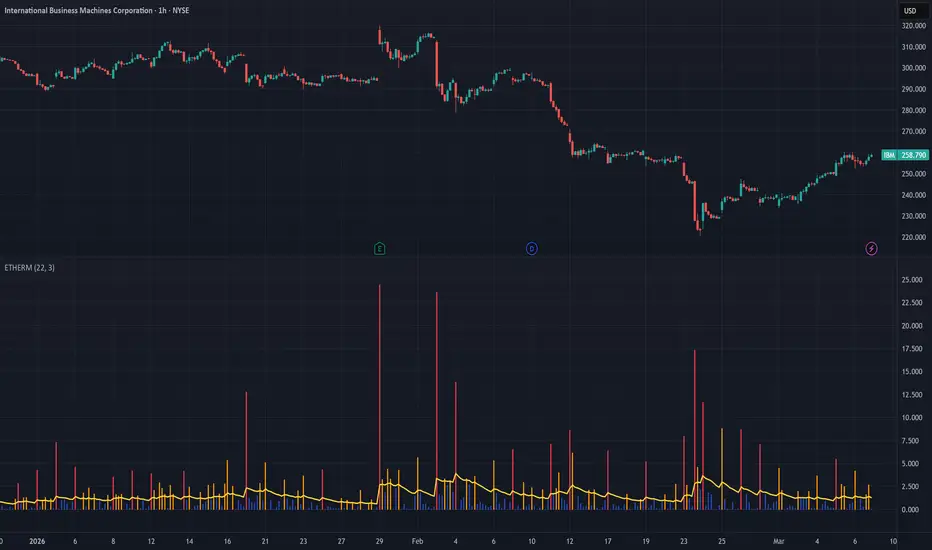
Elder's Thermometer (ETHERM) measures bar-to-bar range extension — the maximum outward protrusion of the current bar beyond the previous bar's high or low. Inward contractions clamp to zero. A bias-compensated EMA signal line provides a smoothed baseline for detecting explosive moves. Output is ≥ 0, in the same units as price.
HISTORICAL CONTEXT
Dr. Alexander Elder introduced the Market Thermometer in Come Into My Trading Room (2002) as part of his Triple Screen trading system. Elder observed that bars extending well beyond the prior bar's range signal heightened volatility — the market "running a fever." ETHERM distinguishes outward breakouts from inward consolidation, making it practical for stop placement and position sizing.
HOW IT WORKS
ETHERM is a two-stage pipeline:
Stage 1 — Temperature
For each bar, compute how far the high protrudes above the previous bar's high, and how far the low protrudes below the previous bar's low. Only outward extensions count; inward contractions clamp to zero. Temperature is the larger of the two protrusions:
T = max( max(High − PrevHigh, 0), max(PrevLow − Low, 0) )
Stage 2 — Signal
A bias-compensated EMA of the temperature provides a smoothed baseline. Bias compensation ensures accuracy from the first valid bar by dividing out the geometric decay factor, converging to a standard EMA as warmup completes.
Explosive move detection
A common approach is to flag bars where Temperature exceeds Signal × multiplier (e.g., 3×) as explosive moves — the market equivalent of a clinical fever.
INPUTS
- Period — Lookback length for the EMA signal line. Default: 22. For period = 22, the signal half-life is approximately 7.6 bars (β ≈ 0.913).
OUTPUTS
- Temperature — Raw bar-level outward extension (current bar only), ≥ 0, price units.
- Signal — Bias-compensated EMA of Temperature. Use this for trend comparisons and threshold logic.
HOW TO USE
Apply to any instrument with real OHLC data (futures, forex, equities, crypto). Requires High and Low — does not work correctly on close-only synthetic charts.
Reading the output
- Temperature near zero: inside bar or small range extension — consolidation.
- Temperature significantly above Signal: explosive outward expansion — elevated volatility, potential breakout or reversal setup.
- Signal rising persistently: sustained volatility expansion in progress.
Suggested use cases
- Stop placement: widen stops when temperature is high; tighten when near zero.
- Position sizing: reduce size when the market is "running a fever."
- Entry filter within a trend-following system: require temperature < Signal before entering (wait for fever to break).
LIMITATIONS
- Warmup: Requires period bars before IsHot = true. Earlier outputs are produced but should be treated as provisional.
- Inside bars: Both protrusions clamp to zero, producing Temperature = 0. This is by design.
- First bar: No previous bar exists; Temperature = 0, signal begins building from bar 2.
- SIMD: The recursive EMA dependency prevents vectorization — no performance benefit from parallel processing.
- No equivalent function exists in TA-Lib, Skender, or Tulip; validation is against Pine output and internal batch/streaming/span consistency.
IMPLEMENTATION
Part of QuanTAlib TA library — an open-source quantitative analysis library for C#, Python and Pine Script. All indicators validated for streaming consistency (same result bar-by-bar vs. batch recalculation).
REFERENCES
- Elder, Alexander (2002). Come Into My Trading Room, Wiley. p. 162.
- Elder, Alexander (1993). Trading for a Living, Wiley.
オープンソーススクリプト
TradingViewの精神に則り、このスクリプトの作者はコードをオープンソースとして公開してくれました。トレーダーが内容を確認・検証できるようにという配慮です。作者に拍手を送りましょう!無料で利用できますが、コードの再公開はハウスルールに従う必要があります。

Rigorous technical indicators for Pine Script 6 with O(1) streaming, defensible math, and proper initialization. Fully documented, implemented in C#, transcribed to Pine Script, and wrapped for Python.
免責事項
これらの情報および投稿は、TradingViewが提供または承認する金融、投資、取引、またはその他の種類の助言もしくは推奨であることを意図したものではなく、またこれらに該当するものでもありません。詳細は利用規約をご覧ください。
オープンソーススクリプト
TradingViewの精神に則り、このスクリプトの作者はコードをオープンソースとして公開してくれました。トレーダーが内容を確認・検証できるようにという配慮です。作者に拍手を送りましょう!無料で利用できますが、コードの再公開はハウスルールに従う必要があります。
Rigorous technical indicators for Pine Script 6 with O(1) streaming, defensible math, and proper initialization. Fully documented, implemented in C#, transcribed to Pine Script, and wrapped for Python.
免責事項
これらの情報および投稿は、TradingViewが提供または承認する金融、投資、取引、またはその他の種類の助言もしくは推奨であることを意図したものではなく、またこれらに該当するものでもありません。詳細は利用規約をご覧ください。