アップデート済
Upvol and Downvol
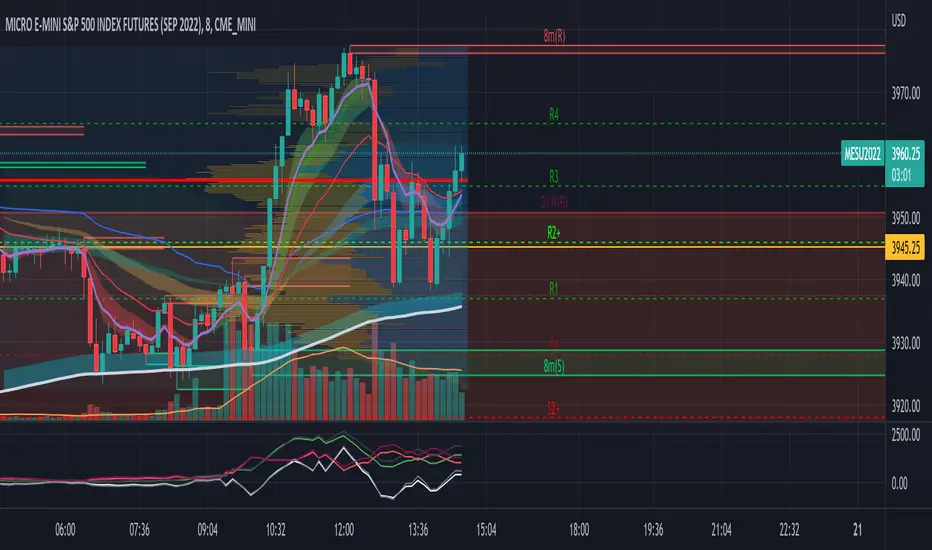
This is a tweaked version of 
What's Added?
- No negative graph lines (I want to see the crossovers in volume)
- Added NQ
- Adjusted enabled tickers (ES and the current ticker are enabled)
- Adjusted the moving average to better fit the strategy I was backtesting
How to use?
I watch it with other indicators for the cross over in positive delta/negative delta of the volume
- short volume crossing above long? consider going long
- long volume crossing below short consider going short
Also watching the total volume to see if it's going up or down (don't enter if it's dropping or consider getting out)
リリースノート
added a commentリリースノート
Fixed a bug
免責事項
これらの情報および投稿は、TradingViewが提供または承認する金融、投資、取引、またはその他の種類の助言もしくは推奨であることを意図したものではなく、またこれらに該当するものでもありません。詳細は利用規約をご覧ください。
免責事項
これらの情報および投稿は、TradingViewが提供または承認する金融、投資、取引、またはその他の種類の助言もしくは推奨であることを意図したものではなく、またこれらに該当するものでもありません。詳細は利用規約をご覧ください。