アップデート済
FVG Streak
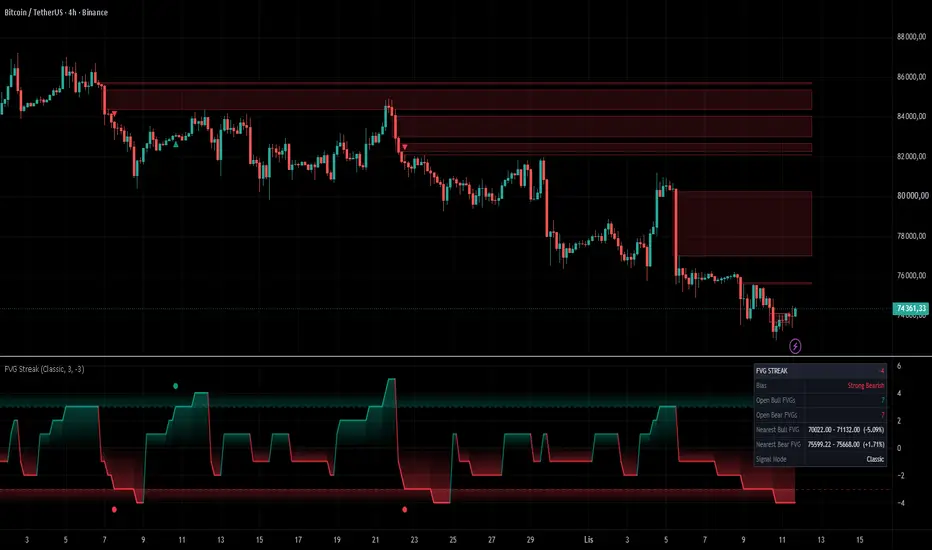
█ OVERVIEW
FVG Streak is a momentum indicator based on the analysis of consecutive Fair Value Gaps (FVG). Instead of evaluating individual gaps, it measures the number of successive bullish or bearish FVGs, creating a counter (Streak) that shows which side of the market currently holds the advantage.
The core idea of the indicator is that a single Fair Value Gap may represent only a temporary market imbalance, while a series of consecutive FVGs forming in the same direction indicates sustained dominance by buyers or sellers.
The indicator builds a counter of successive FVGs without the appearance of an opposite gap. Each new FVG in the current direction increases the counter value, while the appearance of an opposite FVG immediately resets the previous sequence and starts counting from scratch in the new direction.
Once a defined threshold of consecutive bullish or bearish FVGs is reached, the indicator generates BUY and SELL signals, but only on a candle that matches the direction of the FVG. On a candle of the opposite direction, no signal is generated. Additionally, it can draw all detected Fair Value Gap zones on the chart, automatically remove them after mitigation, color the candles according to the dominant direction, and visualize the strength of market dominance using gradients and a colored indicator line.
The result is a tool that allows assessment not only of the occurrence of Fair Value Gaps, but primarily of the persistence of the imbalance between buyers and sellers. This helps distinguish single impulses from situations in which the market consistently builds a strong trend.
█ CONCEPTS
Fair Value Gap (FVG)
The foundation of the indicator is Fair Value Gaps (FVG) — gaps that form between candles and indicate a temporary imbalance between demand and supply.
A bullish FVG occurs when the low of the current candle is above the high of the candle two periods earlier. This means price moved so dynamically that no full trading occurred between those levels.
Similarly, a bearish FVG appears when the high of the current candle is below the low of the candle two periods earlier, indicating strong selling pressure.
Such areas are often interpreted as imbalance zones to which the market may later return.
Consecutive FVG Counter (FVG Streak)
The most important concept of the indicator is the assumption that repeated Fair Value Gaps in the same direction demonstrate trend strength.
A single FVG can appear in virtually any market and does not necessarily signal the start of a strong move. However, if the market creates successive bullish FVGs without the appearance of bearish gaps, it means buyers are continuously maintaining control and are able to repeatedly generate new price imbalances.
Analogously, a series of consecutive bearish FVGs indicates consistent dominance of supply. Each subsequent gap appearing in the same direction strengthens the conviction that the market is in a strong impulse rather than merely performing a short-lived breakout.
Instead of analyzing individual FVGs independently, the indicator treats them as elements of a single sequence. In this way it measures not only the mere occurrence of an imbalance, but also its durability and continuity over time.
The higher the counter value, the longer one side of the market has maintained dominance.
Sequence Reset
The counter operates only until an FVG of the opposite direction appears.
Each successive FVG in the current direction increases the counter by one. The appearance of an opposite FVG immediately ends the previous sequence and starts counting from the value of 1 for the new direction.
Thanks to this, the indicator always shows the current market dominance rather than the sum of all historical gaps.
Signal Thresholds
The user defines the minimum number of consecutive FVGs required to generate a signal.
After the positive threshold is crossed, the indicator generates a BUY signal. After the negative threshold is crossed, a SELL signal appears.
An additional filter is the direction of the current candle. A buy signal can appear only on a bullish candle, while a sell signal only on a bearish candle, which eliminates some random signals.
Visualization of Market Dominance
The indicator line shows the current value of the consecutive FVG counter.
Positive values indicate dominance of bullish Fair Value Gaps. Negative values indicate dominance of bearish Fair Value Gaps.
The line color automatically changes according to the direction of dominance, and an optional gradient between the line and the zero level allows instant assessment of the strength of the current advantage of one side of the market.
Fair Value Gap Zones
The indicator can simultaneously draw all detected Fair Value Gaps directly on the price chart.
Each gap is presented as a rectangle that extends until it is mitigated or reaches the maximum length specified by the user.
Mitigation can occur after the zone is violated by a candle wick or only after the candle closes beyond its boundary, depending on the selected mode.
This allows simultaneous observation of both the current trend strength and potential price reaction zones resulting from remaining imbalances.
█ FEATURES
Signal Settings
• Buy Signal Threshold – number of consecutive bullish Fair Value Gaps required to generate a BUY signal
• Sell Signal Threshold – number of consecutive bearish Fair Value Gaps required to generate a SELL signal
• Show Signals – displays BUY and SELL signals after the defined thresholds are crossed
Appearance
• Bullish Color – color used for positive indicator values, bullish signals, gradients, and bullish FVGs
• Bearish Color – color used for negative indicator values, bearish signals, gradients, and bearish FVGs
• Neutral / Zero Color – color of the zero level and the indicator line when neither side of the market has dominance
• Gradient Transparency – transparency of the gradient between the indicator line and the zero level
• Threshold Band Transparency – transparency of the bands displayed at the signal threshold levels
• Gradient – Buy Threshold – displays a thickened band visualizing the BUY signal threshold
• Gradient – Sell Threshold – displays a thickened band visualizing the SELL signal threshold
• Gradient → Zero – fills the space between the indicator line and the zero level with a gradient showing current market dominance
Fair Value Gap Zones
• Show FVG Boxes on Chart – draws all detected Fair Value Gaps directly on the price chart
• Box Mitigation Source – determines how FVG zones are closed:
– Wick – the zone is closed after being violated by a candle wick
– Close – the zone is closed only after the candle closes beyond its boundary
• Max Box Length – maximum display length of an unmitigated FVG zone; value 0 means no limit
• Border Color – Bullish FVG – border and fill color of bullish FVG zones
• Border Color – Bearish FVG – border and fill color of bearish FVG zones
• Box Fill Transparency – transparency of the FVG zone fill
• Color Bars by FVG Trend – colors the candles according to the current dominance of bullish or bearish FVGs
• Bar Coloring Transparency – transparency of the candle coloring
ATR Filter
• Filter Small FVGs by ATR – ignores Fair Value Gaps smaller than the specified size expressed as a multiple of ATR
• ATR Length – number of bars used to calculate ATR
• ATR Multiplier – minimum FVG size required for the indicator to take it into account
Alerts
• Alert on BUY signal generation
• Alert on SELL signal generation
█ APPLICATIONS
Assessing Trend Strength
The primary use of the indicator is to assess the strength of the current trend by analyzing the number of consecutive Fair Value Gaps forming in the same direction.
Confirming Momentum
A rising counter value means the market is repeatedly creating new imbalances without the appearance of opposite signals.
This can serve as additional confirmation of momentum and the strength of the impulse observed on the chart.
Generating Signals
Crossing a defined threshold of consecutive FVGs generates a BUY or SELL signal.
Signals should not be treated as automatic entry points. They are best used as confirmation of market analysis performed with other tools such as market structure, support and resistance levels, volume analysis, or Order Flow.
Analysis of Active Fair Value Gaps
The rectangles drawn on the chart allow simultaneous observation of all active price imbalances.
Thanks to automatic mitigation, the user sees only those zones that remain relevant from the market’s perspective.
Eliminating Insignificant FVGs
The optional ATR filter allows ignoring very small Fair Value Gaps that are often merely the result of random price movements.
This helps focus the analysis on larger imbalances that more frequently have practical significance.
Visual Assessment of Market Dominance
The line color, gradient, candle coloring, and counter value allow instant determination of which side of the market currently holds the advantage.
Thanks to this, even without analyzing individual FVGs, one can quickly assess the current state of the market.
█ NOTES
• The indicator analyzes exclusively consecutive Fair Value Gaps occurring without interruption in the same direction.
• The appearance of a Fair Value Gap of the opposite direction immediately ends the previous sequence and starts a new count.
• BUY and SELL signals inform about reaching a defined number of consecutive Fair Value Gaps. They do not constitute automatic entry signals, and before making a decision it is advisable to confirm them with other elements of technical analysis such as market structure, support and resistance, volume, or momentum.
FVG Streak is a momentum indicator based on the analysis of consecutive Fair Value Gaps (FVG). Instead of evaluating individual gaps, it measures the number of successive bullish or bearish FVGs, creating a counter (Streak) that shows which side of the market currently holds the advantage.
The core idea of the indicator is that a single Fair Value Gap may represent only a temporary market imbalance, while a series of consecutive FVGs forming in the same direction indicates sustained dominance by buyers or sellers.
The indicator builds a counter of successive FVGs without the appearance of an opposite gap. Each new FVG in the current direction increases the counter value, while the appearance of an opposite FVG immediately resets the previous sequence and starts counting from scratch in the new direction.
Once a defined threshold of consecutive bullish or bearish FVGs is reached, the indicator generates BUY and SELL signals, but only on a candle that matches the direction of the FVG. On a candle of the opposite direction, no signal is generated. Additionally, it can draw all detected Fair Value Gap zones on the chart, automatically remove them after mitigation, color the candles according to the dominant direction, and visualize the strength of market dominance using gradients and a colored indicator line.
The result is a tool that allows assessment not only of the occurrence of Fair Value Gaps, but primarily of the persistence of the imbalance between buyers and sellers. This helps distinguish single impulses from situations in which the market consistently builds a strong trend.
█ CONCEPTS
Fair Value Gap (FVG)
The foundation of the indicator is Fair Value Gaps (FVG) — gaps that form between candles and indicate a temporary imbalance between demand and supply.
A bullish FVG occurs when the low of the current candle is above the high of the candle two periods earlier. This means price moved so dynamically that no full trading occurred between those levels.
Similarly, a bearish FVG appears when the high of the current candle is below the low of the candle two periods earlier, indicating strong selling pressure.
Such areas are often interpreted as imbalance zones to which the market may later return.
Consecutive FVG Counter (FVG Streak)
The most important concept of the indicator is the assumption that repeated Fair Value Gaps in the same direction demonstrate trend strength.
A single FVG can appear in virtually any market and does not necessarily signal the start of a strong move. However, if the market creates successive bullish FVGs without the appearance of bearish gaps, it means buyers are continuously maintaining control and are able to repeatedly generate new price imbalances.
Analogously, a series of consecutive bearish FVGs indicates consistent dominance of supply. Each subsequent gap appearing in the same direction strengthens the conviction that the market is in a strong impulse rather than merely performing a short-lived breakout.
Instead of analyzing individual FVGs independently, the indicator treats them as elements of a single sequence. In this way it measures not only the mere occurrence of an imbalance, but also its durability and continuity over time.
The higher the counter value, the longer one side of the market has maintained dominance.
Sequence Reset
The counter operates only until an FVG of the opposite direction appears.
Each successive FVG in the current direction increases the counter by one. The appearance of an opposite FVG immediately ends the previous sequence and starts counting from the value of 1 for the new direction.
Thanks to this, the indicator always shows the current market dominance rather than the sum of all historical gaps.
Signal Thresholds
The user defines the minimum number of consecutive FVGs required to generate a signal.
After the positive threshold is crossed, the indicator generates a BUY signal. After the negative threshold is crossed, a SELL signal appears.
An additional filter is the direction of the current candle. A buy signal can appear only on a bullish candle, while a sell signal only on a bearish candle, which eliminates some random signals.
Visualization of Market Dominance
The indicator line shows the current value of the consecutive FVG counter.
Positive values indicate dominance of bullish Fair Value Gaps. Negative values indicate dominance of bearish Fair Value Gaps.
The line color automatically changes according to the direction of dominance, and an optional gradient between the line and the zero level allows instant assessment of the strength of the current advantage of one side of the market.
Fair Value Gap Zones
The indicator can simultaneously draw all detected Fair Value Gaps directly on the price chart.
Each gap is presented as a rectangle that extends until it is mitigated or reaches the maximum length specified by the user.
Mitigation can occur after the zone is violated by a candle wick or only after the candle closes beyond its boundary, depending on the selected mode.
This allows simultaneous observation of both the current trend strength and potential price reaction zones resulting from remaining imbalances.
█ FEATURES
Signal Settings
• Buy Signal Threshold – number of consecutive bullish Fair Value Gaps required to generate a BUY signal
• Sell Signal Threshold – number of consecutive bearish Fair Value Gaps required to generate a SELL signal
• Show Signals – displays BUY and SELL signals after the defined thresholds are crossed
Appearance
• Bullish Color – color used for positive indicator values, bullish signals, gradients, and bullish FVGs
• Bearish Color – color used for negative indicator values, bearish signals, gradients, and bearish FVGs
• Neutral / Zero Color – color of the zero level and the indicator line when neither side of the market has dominance
• Gradient Transparency – transparency of the gradient between the indicator line and the zero level
• Threshold Band Transparency – transparency of the bands displayed at the signal threshold levels
• Gradient – Buy Threshold – displays a thickened band visualizing the BUY signal threshold
• Gradient – Sell Threshold – displays a thickened band visualizing the SELL signal threshold
• Gradient → Zero – fills the space between the indicator line and the zero level with a gradient showing current market dominance
Fair Value Gap Zones
• Show FVG Boxes on Chart – draws all detected Fair Value Gaps directly on the price chart
• Box Mitigation Source – determines how FVG zones are closed:
– Wick – the zone is closed after being violated by a candle wick
– Close – the zone is closed only after the candle closes beyond its boundary
• Max Box Length – maximum display length of an unmitigated FVG zone; value 0 means no limit
• Border Color – Bullish FVG – border and fill color of bullish FVG zones
• Border Color – Bearish FVG – border and fill color of bearish FVG zones
• Box Fill Transparency – transparency of the FVG zone fill
• Color Bars by FVG Trend – colors the candles according to the current dominance of bullish or bearish FVGs
• Bar Coloring Transparency – transparency of the candle coloring
ATR Filter
• Filter Small FVGs by ATR – ignores Fair Value Gaps smaller than the specified size expressed as a multiple of ATR
• ATR Length – number of bars used to calculate ATR
• ATR Multiplier – minimum FVG size required for the indicator to take it into account
Alerts
• Alert on BUY signal generation
• Alert on SELL signal generation
█ APPLICATIONS
Assessing Trend Strength
The primary use of the indicator is to assess the strength of the current trend by analyzing the number of consecutive Fair Value Gaps forming in the same direction.
Confirming Momentum
A rising counter value means the market is repeatedly creating new imbalances without the appearance of opposite signals.
This can serve as additional confirmation of momentum and the strength of the impulse observed on the chart.
Generating Signals
Crossing a defined threshold of consecutive FVGs generates a BUY or SELL signal.
Signals should not be treated as automatic entry points. They are best used as confirmation of market analysis performed with other tools such as market structure, support and resistance levels, volume analysis, or Order Flow.
Analysis of Active Fair Value Gaps
The rectangles drawn on the chart allow simultaneous observation of all active price imbalances.
Thanks to automatic mitigation, the user sees only those zones that remain relevant from the market’s perspective.
Eliminating Insignificant FVGs
The optional ATR filter allows ignoring very small Fair Value Gaps that are often merely the result of random price movements.
This helps focus the analysis on larger imbalances that more frequently have practical significance.
Visual Assessment of Market Dominance
The line color, gradient, candle coloring, and counter value allow instant determination of which side of the market currently holds the advantage.
Thanks to this, even without analyzing individual FVGs, one can quickly assess the current state of the market.
█ NOTES
• The indicator analyzes exclusively consecutive Fair Value Gaps occurring without interruption in the same direction.
• The appearance of a Fair Value Gap of the opposite direction immediately ends the previous sequence and starts a new count.
• BUY and SELL signals inform about reaching a defined number of consecutive Fair Value Gaps. They do not constitute automatic entry signals, and before making a decision it is advisable to confirm them with other elements of technical analysis such as market structure, support and resistance, volume, or momentum.
リリースノート
- Displacement candle (optional): the middle candle must close in the direction of the gap, so gaps from wicks alone or news spikes that reversed are ignored.- Streak reset (optional): the counter returns to 0 after N bars without a new gap.
- New "Armed" signal mode, confirmation on bar close, and signals on the price chart
- Expanded FVG zones: extend right, shrink on partial fill, history, 50% line (CE), zone limit
- Dashboard and new alerts
- Refreshed visuals, reorganized settings and rewritten tooltips
- New defaults: ATR filter on, bar coloring off

免責事項
これらの情報および投稿は、TradingViewが提供または承認する金融、投資、取引、またはその他の種類の助言もしくは推奨であることを意図したものではなく、またこれらに該当するものでもありません。詳細は利用規約をご覧ください。
免責事項
これらの情報および投稿は、TradingViewが提供または承認する金融、投資、取引、またはその他の種類の助言もしくは推奨であることを意図したものではなく、またこれらに該当するものでもありません。詳細は利用規約をご覧ください。