OPEN-SOURCE SCRIPT
50-MA Extension Dot [ATR / % / Points]
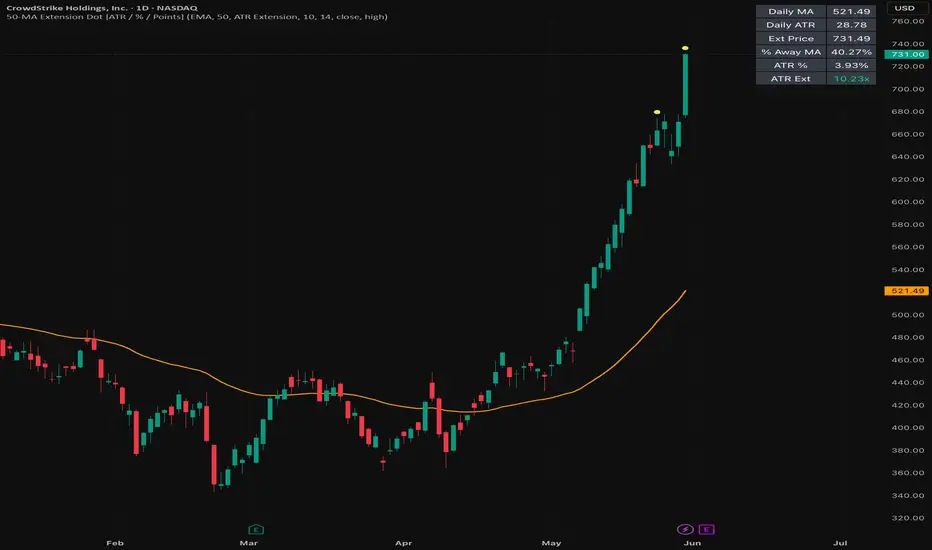
50-MA Extension Dot [ATR / % / Points] marks when price has moved a defined distance above a daily moving-average anchor. The goal of the script is to help traders study when price becomes extended relative to its daily trend structure, rather than judging a move by price alone.
The script supports three extension methods: ATR Extension, Percent, and Points. ATR Extension compares the distance from price to the daily moving average against the instrument’s daily ATR, making the reading volatility-adjusted. Percent mode measures how far price is above the moving average in percentage terms. Points mode measures the raw point distance above the moving-average anchor.
The moving-average type, moving-average length, threshold method, threshold value, ATR length, and extension source are customizable so traders can study past moves and build their own rules. For example, users can test how a symbol historically behaved when it became one ATR, two ATRs, a fixed percentage, or a fixed point distance above its daily moving-average reference.
When the selected threshold is reached, the script plots a small dot above the candle. The dot is not a standalone buy or sell signal. It is a visual marker showing that price has reached a defined extension zone relative to the chosen daily moving-average reference.
The script can also display the daily moving average, an optional threshold line, and a small table showing the current daily moving average, daily ATR, extension price, percentage distance from the moving average, ATR percentage, and ATR extension value.
This tool is useful for studying stretched moves, breakout extensions, momentum exhaustion, and conditions where price may be moving too far too quickly above its daily trend anchor. Because different symbols have different volatility profiles, the customizable inputs allow traders to compare past extensions and develop rules that fit their own process.
This indicator does not predict future price movement. It is a contextual extension tool designed to measure distance from a daily trend reference and help traders research historical extension behavior.
The script supports three extension methods: ATR Extension, Percent, and Points. ATR Extension compares the distance from price to the daily moving average against the instrument’s daily ATR, making the reading volatility-adjusted. Percent mode measures how far price is above the moving average in percentage terms. Points mode measures the raw point distance above the moving-average anchor.
The moving-average type, moving-average length, threshold method, threshold value, ATR length, and extension source are customizable so traders can study past moves and build their own rules. For example, users can test how a symbol historically behaved when it became one ATR, two ATRs, a fixed percentage, or a fixed point distance above its daily moving-average reference.
When the selected threshold is reached, the script plots a small dot above the candle. The dot is not a standalone buy or sell signal. It is a visual marker showing that price has reached a defined extension zone relative to the chosen daily moving-average reference.
The script can also display the daily moving average, an optional threshold line, and a small table showing the current daily moving average, daily ATR, extension price, percentage distance from the moving average, ATR percentage, and ATR extension value.
This tool is useful for studying stretched moves, breakout extensions, momentum exhaustion, and conditions where price may be moving too far too quickly above its daily trend anchor. Because different symbols have different volatility profiles, the customizable inputs allow traders to compare past extensions and develop rules that fit their own process.
This indicator does not predict future price movement. It is a contextual extension tool designed to measure distance from a daily trend reference and help traders research historical extension behavior.
オープンソーススクリプト
TradingViewの精神に則り、このスクリプトの作者はコードをオープンソースとして公開してくれました。トレーダーが内容を確認・検証できるようにという配慮です。作者に拍手を送りましょう!無料で利用できますが、コードの再公開はハウスルールに従う必要があります。

Independent market structure tools and educational chart analysis for learning and review only. Not financial advice.
免責事項
これらの情報および投稿は、TradingViewが提供または承認する金融、投資、取引、またはその他の種類の助言もしくは推奨であることを意図したものではなく、またこれらに該当するものでもありません。詳細は利用規約をご覧ください。
オープンソーススクリプト
TradingViewの精神に則り、このスクリプトの作者はコードをオープンソースとして公開してくれました。トレーダーが内容を確認・検証できるようにという配慮です。作者に拍手を送りましょう!無料で利用できますが、コードの再公開はハウスルールに従う必要があります。
Independent market structure tools and educational chart analysis for learning and review only. Not financial advice.
免責事項
これらの情報および投稿は、TradingViewが提供または承認する金融、投資、取引、またはその他の種類の助言もしくは推奨であることを意図したものではなく、またこれらに該当するものでもありません。詳細は利用規約をご覧ください。