SPY Bear Regime Short System
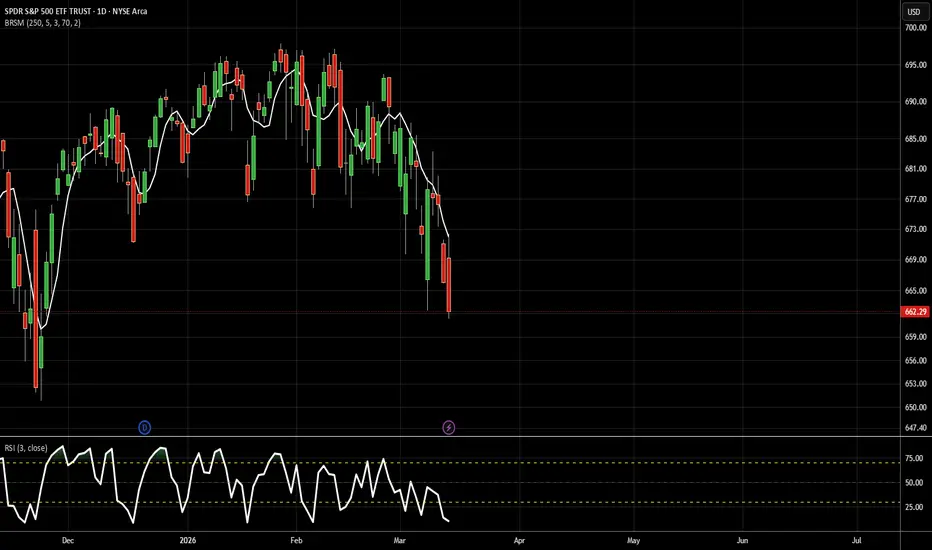
SPY Bear Regime Short System
A rules-based short-selling strategy designed to profit during bear market regimes. Backtested on SPY daily data from 1994 to 2025 using Wealth-Lab 8.
The system identifies weak counter-trend bounces within established downtrends and shorts them with mechanical entry and exit rules. No discretion, no optimization — just objective conditions applied consistently over 30 years.
ENTRY CONDITIONS (all four must be true):
1. Close is below the 250-period simple moving average (bear regime confirmed)
2. Close is above the 5-period simple moving average (short-term bounce in progress)
3. 3-period RSI crosses above 70 (bounce is becoming overbought)
4. Close is at least 2% below the 250-period MA (keeps you away from the MA where direction is ambiguous)
EXIT CONDITIONS (first one triggered):
1. Close drops back below the 5-period MA (bounce has failed — trade worked)
2. Close rises above the 250-period MA (bear regime may be ending — get out)
All entries and exits are executed at the next bar open.
BACKTEST RESULTS (SPY daily, 1994–2025):
Win rate: 70.16%
Average winner: +1.77% — average hold 3.1 bars
Average loser: -2.12% — average hold 5.0 bars
BEAR MARKET PERFORMANCE vs SPY:
2000: System +8.31% | SPY -10.53%
2001: System +21.10% | SPY -12.86%
2002: System +1.55% | SPY -22.78%
2008: System +35.29% | SPY -36.71%
2022: System +20.29% | SPY -18.11%
HOW TO USE:
Apply to SPY on the daily timeframe. The 250 MA (yellow) and 5 MA (white) plot on the price chart. The companion RSI indicator plots in a separate pane below. Short entry signals appear as red triangles above the bar. Exit signals appear as green triangles below the bar.
Because SPY correlation with large-cap stocks runs high during bear markets, signals can also serve as a regime filter for shorting individual names or sector ETFs.
INPUTS (adjustable in settings):
- Long MA length (default 250)
- Short MA length (default 5)
- RSI length (default 3)
- RSI overbought threshold (default 70)
- Minimum % gap below long MA (default 2%)
Find more systems at:TradingTimeMachine.com/systems
DISCLAIMER:
Past performance is not indicative of future results. This script is for educational purposes only and does not constitute financial advice. Always do your own research before trading.
A rules-based short-selling strategy designed to profit during bear market regimes. Backtested on SPY daily data from 1994 to 2025 using Wealth-Lab 8.
The system identifies weak counter-trend bounces within established downtrends and shorts them with mechanical entry and exit rules. No discretion, no optimization — just objective conditions applied consistently over 30 years.
ENTRY CONDITIONS (all four must be true):
1. Close is below the 250-period simple moving average (bear regime confirmed)
2. Close is above the 5-period simple moving average (short-term bounce in progress)
3. 3-period RSI crosses above 70 (bounce is becoming overbought)
4. Close is at least 2% below the 250-period MA (keeps you away from the MA where direction is ambiguous)
EXIT CONDITIONS (first one triggered):
1. Close drops back below the 5-period MA (bounce has failed — trade worked)
2. Close rises above the 250-period MA (bear regime may be ending — get out)
All entries and exits are executed at the next bar open.
BACKTEST RESULTS (SPY daily, 1994–2025):
Win rate: 70.16%
Average winner: +1.77% — average hold 3.1 bars
Average loser: -2.12% — average hold 5.0 bars
BEAR MARKET PERFORMANCE vs SPY:
2000: System +8.31% | SPY -10.53%
2001: System +21.10% | SPY -12.86%
2002: System +1.55% | SPY -22.78%
2008: System +35.29% | SPY -36.71%
2022: System +20.29% | SPY -18.11%
HOW TO USE:
Apply to SPY on the daily timeframe. The 250 MA (yellow) and 5 MA (white) plot on the price chart. The companion RSI indicator plots in a separate pane below. Short entry signals appear as red triangles above the bar. Exit signals appear as green triangles below the bar.
Because SPY correlation with large-cap stocks runs high during bear markets, signals can also serve as a regime filter for shorting individual names or sector ETFs.
INPUTS (adjustable in settings):
- Long MA length (default 250)
- Short MA length (default 5)
- RSI length (default 3)
- RSI overbought threshold (default 70)
- Minimum % gap below long MA (default 2%)
Find more systems at:TradingTimeMachine.com/systems
DISCLAIMER:
Past performance is not indicative of future results. This script is for educational purposes only and does not constitute financial advice. Always do your own research before trading.

免責事項
これらの情報および投稿は、TradingViewが提供または承認する金融、投資、取引、またはその他の種類の助言もしくは推奨であることを意図したものではなく、またこれらに該当するものでもありません。詳細は利用規約をご覧ください。
免責事項
これらの情報および投稿は、TradingViewが提供または承認する金融、投資、取引、またはその他の種類の助言もしくは推奨であることを意図したものではなく、またこれらに該当するものでもありません。詳細は利用規約をご覧ください。