OPEN-SOURCE SCRIPT
更新済 Intraday EMA
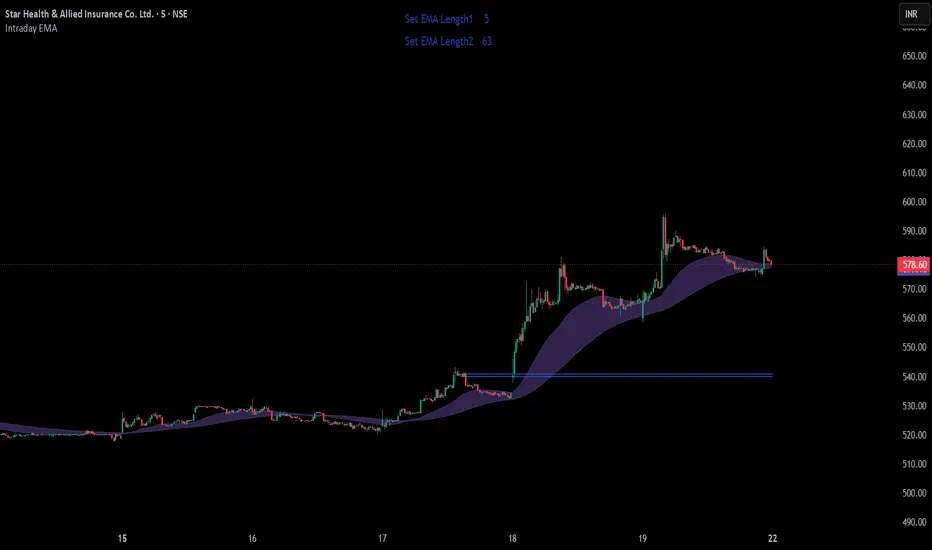
Short Description
Dynamic EMA Envelope based on recent hourly high/low structure with optional single EMA mode.
Full Publishing Description
Intraday EMA Envelope
Intraday EMA Envelope is a lightweight trend-following indicator designed for intraday traders who want adaptive EMA-based structure visualization.
The script derives EMA reference lengths from recent hourly market behavior using highest and lowest price offsets over a configurable lookback period.
Features
• Adaptive EMA logic based on hourly market structure
• Optional Single EMA mode
• EMA Envelope visualization with fill zone
• Smooth EMA calculations for cleaner trend tracking
• Real-time EMA length display table
• Mutually exclusive display modes for clean chart appearance
How It Works
The indicator scans hourly candles over the selected lookback period and calculates:
Highest high offset
Lowest low offset
These offsets are converted into dynamic EMA reference lengths.
Two smoothed EMAs are then plotted:
Upper EMA
Lower EMA
Users can choose between:
Single EMA mode
EMA Envelope mode
Both modes are intentionally made mutually exclusive to avoid chart clutter.
Inputs
• Lookback Days
Controls the hourly historical range used for EMA calculations.
• Show Single EMA
Displays only one smoothed EMA.
• Show EMA Envelope
Displays the EMA channel/envelope with fill.
Best Usage
This indicator works best for:
Intraday trend identification
Pullback trading
Dynamic support/resistance tracking
Trend continuation setups
Dynamic EMA Envelope based on recent hourly high/low structure with optional single EMA mode.
Full Publishing Description
Intraday EMA Envelope
Intraday EMA Envelope is a lightweight trend-following indicator designed for intraday traders who want adaptive EMA-based structure visualization.
The script derives EMA reference lengths from recent hourly market behavior using highest and lowest price offsets over a configurable lookback period.
Features
• Adaptive EMA logic based on hourly market structure
• Optional Single EMA mode
• EMA Envelope visualization with fill zone
• Smooth EMA calculations for cleaner trend tracking
• Real-time EMA length display table
• Mutually exclusive display modes for clean chart appearance
How It Works
The indicator scans hourly candles over the selected lookback period and calculates:
Highest high offset
Lowest low offset
These offsets are converted into dynamic EMA reference lengths.
Two smoothed EMAs are then plotted:
Upper EMA
Lower EMA
Users can choose between:
Single EMA mode
EMA Envelope mode
Both modes are intentionally made mutually exclusive to avoid chart clutter.
Inputs
• Lookback Days
Controls the hourly historical range used for EMA calculations.
• Show Single EMA
Displays only one smoothed EMA.
• Show EMA Envelope
Displays the EMA channel/envelope with fill.
Best Usage
This indicator works best for:
Intraday trend identification
Pullback trading
Dynamic support/resistance tracking
Trend continuation setups
リリースノート
Added :- EMA Cycle Confluence Detector [LCM Based]""Identifies synchronization points between two EMA cycle lengths using Least Common Multiple (LCM) calculations and automatically plots the latest confluence high-low zone for support and resistance analysis."
オープンソーススクリプト
TradingViewの精神に則り、このスクリプトの作者はコードをオープンソースとして公開してくれました。トレーダーが内容を確認・検証できるようにという配慮です。作者に拍手を送りましょう!無料で利用できますが、コードの再公開はハウスルールに従う必要があります。

免責事項
これらの情報および投稿は、TradingViewが提供または承認する金融、投資、取引、またはその他の種類の助言もしくは推奨であることを意図したものではなく、またこれらに該当するものでもありません。詳細は利用規約をご覧ください。
オープンソーススクリプト
TradingViewの精神に則り、このスクリプトの作者はコードをオープンソースとして公開してくれました。トレーダーが内容を確認・検証できるようにという配慮です。作者に拍手を送りましょう!無料で利用できますが、コードの再公開はハウスルールに従う必要があります。
免責事項
これらの情報および投稿は、TradingViewが提供または承認する金融、投資、取引、またはその他の種類の助言もしくは推奨であることを意図したものではなく、またこれらに該当するものでもありません。詳細は利用規約をご覧ください。