OPEN-SOURCE SCRIPT
Moving Average Cross Alert, Multi-Timeframe (MTF) (by ChartArt)
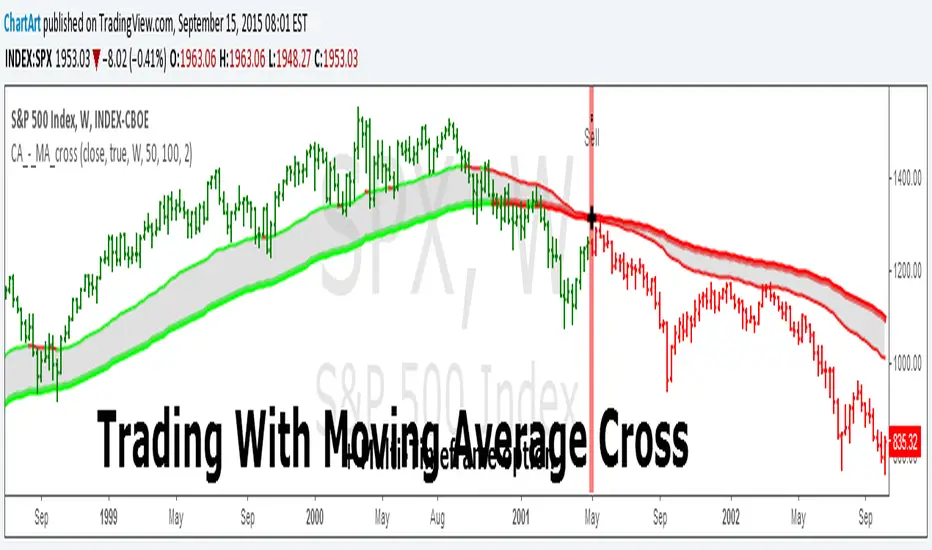
See when two moving averages cross. With the option to choose between four moving average calculations:
The moving averages can be plotted from different time-frames, like e.g. the weekly or 4 hour time-frame using HL2, HLC3 or OHLC4 as price source for the calculation. In addition there is a background color alert and arrows when the moving averages cross each other when the price also rises or falls. And the moving averages are colored depending on their trend direction (if they are trending up or down).
- SMA = simple moving average
- EMA = exponential moving average (default)
- WMA = weighted moving average
- Linear = linear regression
The moving averages can be plotted from different time-frames, like e.g. the weekly or 4 hour time-frame using HL2, HLC3 or OHLC4 as price source for the calculation. In addition there is a background color alert and arrows when the moving averages cross each other when the price also rises or falls. And the moving averages are colored depending on their trend direction (if they are trending up or down).
オープンソーススクリプト
TradingViewの精神に則り、このスクリプトの作者はコードをオープンソースとして公開してくれました。トレーダーが内容を確認・検証できるようにという配慮です。作者に拍手を送りましょう!無料で利用できますが、コードの再公開はハウスルールに従う必要があります。

免責事項
これらの情報および投稿は、TradingViewが提供または承認する金融、投資、取引、またはその他の種類の助言もしくは推奨であることを意図したものではなく、またこれらに該当するものでもありません。詳細は利用規約をご覧ください。
オープンソーススクリプト
TradingViewの精神に則り、このスクリプトの作者はコードをオープンソースとして公開してくれました。トレーダーが内容を確認・検証できるようにという配慮です。作者に拍手を送りましょう!無料で利用できますが、コードの再公開はハウスルールに従う必要があります。
免責事項
これらの情報および投稿は、TradingViewが提供または承認する金融、投資、取引、またはその他の種類の助言もしくは推奨であることを意図したものではなく、またこれらに該当するものでもありません。詳細は利用規約をご覧ください。