Previous high to Close Previous low to Close fib levels
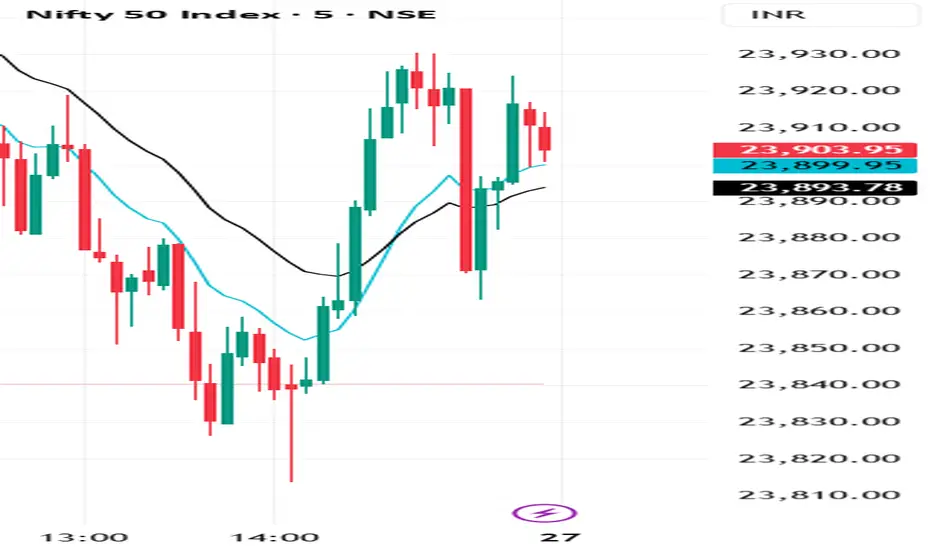
This script, Fib Bridge: H/L to First Close, is a specialized technical analysis tool designed to identify intraday support and resistance levels based on the relationship between previous period extremes and the opening price action.
Core Functionality
Anchor Periods: Automatically calculates levels based on the Previous Day or Previous Week high/low.
The "Fib Bridge": It constructs Fibonacci-style "bridges" between the previous period's high/low and the closing price of the first candle of the current session.
ORB Levels: Visualizes the Opening Range Breakout (ORB) High, Low, and Midpoint of the first candle for immediate bias.
Bull & Bear Zones: * Bull Bridge: Projects the 50% midpoint between the Previous Low and the first Close.
Bear Bridge: Projects the 50% midpoint between the Previous High and the first Close.
Dynamic Visuals: Includes real-time line extensions and customizable labels for price precision.
Core Functionality
Anchor Periods: Automatically calculates levels based on the Previous Day or Previous Week high/low.
The "Fib Bridge": It constructs Fibonacci-style "bridges" between the previous period's high/low and the closing price of the first candle of the current session.
ORB Levels: Visualizes the Opening Range Breakout (ORB) High, Low, and Midpoint of the first candle for immediate bias.
Bull & Bear Zones: * Bull Bridge: Projects the 50% midpoint between the Previous Low and the first Close.
Bear Bridge: Projects the 50% midpoint between the Previous High and the first Close.
Dynamic Visuals: Includes real-time line extensions and customizable labels for price precision.

免責事項
これらの情報および投稿は、TradingViewが提供または承認する金融、投資、取引、またはその他の種類の助言もしくは推奨であることを意図したものではなく、またこれらに該当するものでもありません。詳細は利用規約をご覧ください。
免責事項
これらの情報および投稿は、TradingViewが提供または承認する金融、投資、取引、またはその他の種類の助言もしくは推奨であることを意図したものではなく、またこれらに該当するものでもありません。詳細は利用規約をご覧ください。