Useless Traders SPY UVXY Inversion Signals 2.0
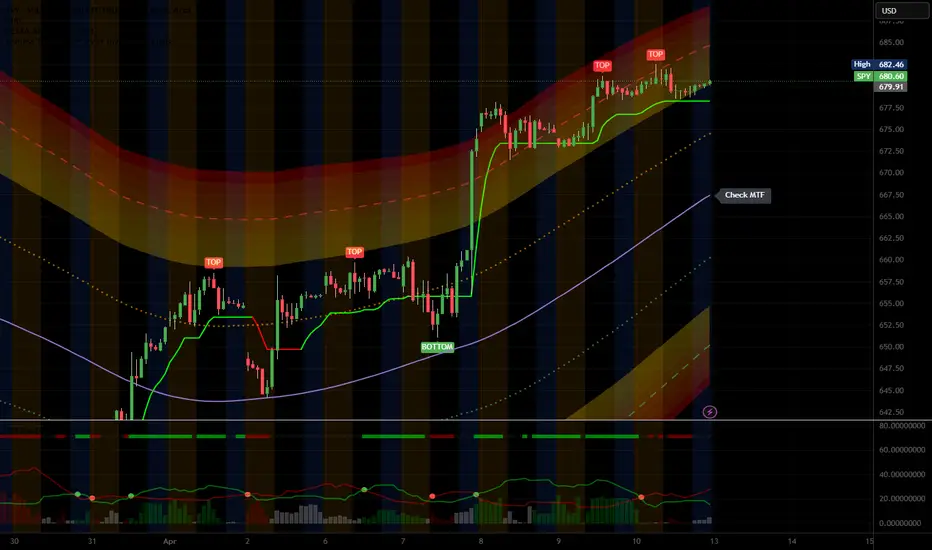
Why this is a powerful way to trade SPY:
The Inversion: UVXY and SPY are inversely correlated. When UVXY's RSI is Overbought (above 70), it usually means maximum fear in the market, which often marks a bottom for SPY.
Pivot Confirmation:
By using "Pivot Strength" , the script won't just fire a signal the moment UVXY hits 70. It waits to see if SPY actually forms a price "floor" first.
Settings Tip:
For SPY day trading (1m or 5m charts), try setting "Pivot Strength" to 3.
For swing trading (Daily chart), leave it at 5 or move it to 7 or 9.
Tips for Using this on SPY:
Timeframe Matters:
On a 5-minute chart, SPY hits RSI 70/30 frequently.
On a Daily chart, SPY can go months without touching RSI 30. If you see no green labels on the daily chart, consider changing the Oversold Level to 35 or 40.
Divergence Watching:
If SPY makes a "Lower High" in price but the script doesn't trigger a new red label, or if it makes a "Higher High" but RSI is lower, you are seeing RSI Divergence, which is a very strong signal for SPY reversals.
Pivot Strength:
I set the default to 5. This means the script waits for 5 bars to pass in order to "confirm" that a high was actually a high. If you want faster (but riskier) signals, drop this to 2 or 3.
This script is ready to go for SPY. Since SPY represents a basket of 500 stocks, it is much less "jumpy" than UVXY, meaning your RSI levels and Pivot Strength will act as your primary filters for quality signals.
I’ve made one small but vital adjustment to the logic : requesting data from UVXY while you are on the SPY chart. This allows you to see SPY's price action but highlights the highs/lows based on when UVXY hits RSI extremes—a common "fear gauge" strategy.
The script will work on both the 5m to 30m (and even the 1hr) SPY charts ideally , but you should be aware of a few "behavioral" differences in how the indicator will look and feel on those different timeframes.
1. Responsiveness vs. Noise
On the 5m Chart: SPY and UVXY move quickly. You will see more labels because RSI hits extremes (30/70) much more frequently during intraday swings. This is great for scalping, but you might get "fake-outs" where the price makes a small pivot and then keeps going.
On the 30m or 1hr Chart: Signals will be much rarer but significantly more "important." When a 30m or 1hr pivot aligns with an RSI extreme, it usually marks a more sustainable trend reversal for the day or the following session.
2. The "Wait" Period (Pivot Strength)
The "Pivot Strength" setting (defaulted to 5) behaves differently depending on the timeframe:
On 5m : for example : The script waits 25 minutes (5 bars × 5 mins) to confirm a high/low.
On 30m : for example : The script waits 2.5 hours (5 bars × 30 mins) to confirm.
Pro Tip : If you feel the 30m chart is "too slow" to show the labels, try reducing the Pivot Strength to 2 or 3. This will make the labels appear sooner after the peak/valley forms.
3. Why the "Sync" Version is Better for 30m.
Intraday Sync : TradingView's request.security function automatically matches the timeframe. If you are on the 30m SPY chart, it pulls the 30m UVXY data.
Volatility Lead : Often, UVXY will hit its RSI extreme a few minutes before SPY finishes its pivot. On a 30m chart or 1hr chart, this gives you a heads-up that a reversal is likely building before the bar even closes.
~TheUselessTrader
The Inversion: UVXY and SPY are inversely correlated. When UVXY's RSI is Overbought (above 70), it usually means maximum fear in the market, which often marks a bottom for SPY.
Pivot Confirmation:
By using "Pivot Strength" , the script won't just fire a signal the moment UVXY hits 70. It waits to see if SPY actually forms a price "floor" first.
Settings Tip:
For SPY day trading (1m or 5m charts), try setting "Pivot Strength" to 3.
For swing trading (Daily chart), leave it at 5 or move it to 7 or 9.
Tips for Using this on SPY:
Timeframe Matters:
On a 5-minute chart, SPY hits RSI 70/30 frequently.
On a Daily chart, SPY can go months without touching RSI 30. If you see no green labels on the daily chart, consider changing the Oversold Level to 35 or 40.
Divergence Watching:
If SPY makes a "Lower High" in price but the script doesn't trigger a new red label, or if it makes a "Higher High" but RSI is lower, you are seeing RSI Divergence, which is a very strong signal for SPY reversals.
Pivot Strength:
I set the default to 5. This means the script waits for 5 bars to pass in order to "confirm" that a high was actually a high. If you want faster (but riskier) signals, drop this to 2 or 3.
This script is ready to go for SPY. Since SPY represents a basket of 500 stocks, it is much less "jumpy" than UVXY, meaning your RSI levels and Pivot Strength will act as your primary filters for quality signals.
I’ve made one small but vital adjustment to the logic : requesting data from UVXY while you are on the SPY chart. This allows you to see SPY's price action but highlights the highs/lows based on when UVXY hits RSI extremes—a common "fear gauge" strategy.
The script will work on both the 5m to 30m (and even the 1hr) SPY charts ideally , but you should be aware of a few "behavioral" differences in how the indicator will look and feel on those different timeframes.
1. Responsiveness vs. Noise
On the 5m Chart: SPY and UVXY move quickly. You will see more labels because RSI hits extremes (30/70) much more frequently during intraday swings. This is great for scalping, but you might get "fake-outs" where the price makes a small pivot and then keeps going.
On the 30m or 1hr Chart: Signals will be much rarer but significantly more "important." When a 30m or 1hr pivot aligns with an RSI extreme, it usually marks a more sustainable trend reversal for the day or the following session.
2. The "Wait" Period (Pivot Strength)
The "Pivot Strength" setting (defaulted to 5) behaves differently depending on the timeframe:
On 5m : for example : The script waits 25 minutes (5 bars × 5 mins) to confirm a high/low.
On 30m : for example : The script waits 2.5 hours (5 bars × 30 mins) to confirm.
Pro Tip : If you feel the 30m chart is "too slow" to show the labels, try reducing the Pivot Strength to 2 or 3. This will make the labels appear sooner after the peak/valley forms.
3. Why the "Sync" Version is Better for 30m.
Intraday Sync : TradingView's request.security function automatically matches the timeframe. If you are on the 30m SPY chart, it pulls the 30m UVXY data.
Volatility Lead : Often, UVXY will hit its RSI extreme a few minutes before SPY finishes its pivot. On a 30m chart or 1hr chart, this gives you a heads-up that a reversal is likely building before the bar even closes.
~TheUselessTrader

免責事項
これらの情報および投稿は、TradingViewが提供または承認する金融、投資、取引、またはその他の種類の助言もしくは推奨であることを意図したものではなく、またこれらに該当するものでもありません。詳細は利用規約をご覧ください。
免責事項
これらの情報および投稿は、TradingViewが提供または承認する金融、投資、取引、またはその他の種類の助言もしくは推奨であることを意図したものではなく、またこれらに該当するものでもありません。詳細は利用規約をご覧ください。