OPEN-SOURCE SCRIPT
更新済 Core Structure Break [UkutaLabs]
█ OVERVIEW
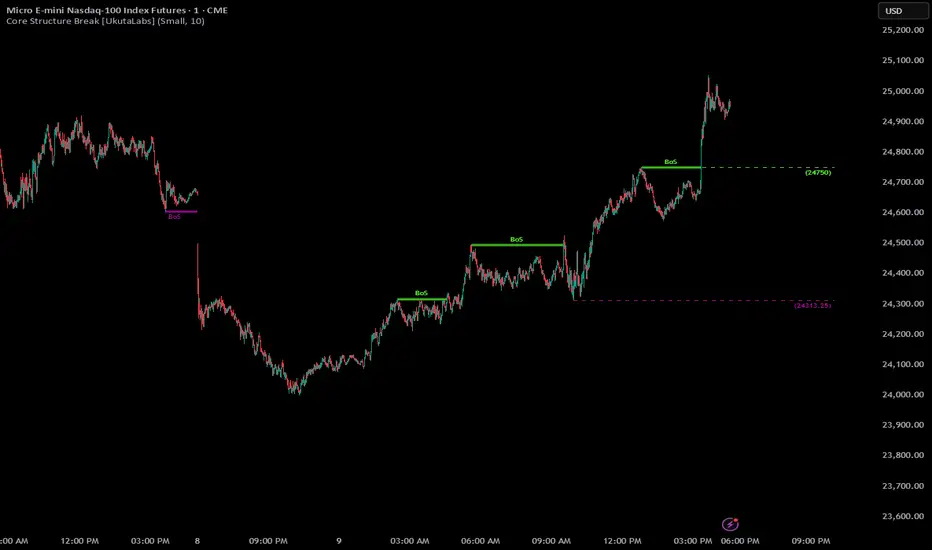
Core Structure Break is designed to automatically detect Breaks of Structure (BoS) in price action, helping traders quickly identify when the market transitions from one structural phase to another.
A Break of Structure occurs when price moves beyond a previous swing high or swing low, signaling that the current trend may be continuing or shifting. These moments are often where momentum accelerates as liquidity is taken and market participants reposition.
This indicator removes the need to manually track swing points by automatically identifying key structure levels and highlighting when they are broken.
By clearly marking these structural events, traders can better understand trend continuation, potential reversals, and areas where liquidity has likely been taken.
█ FEATURES
Automatic Structure Detection
Identifies important swing highs and lows to define the current market structure.
Break of Structure Signals (BoS)
Highlights when price breaks a previously established structural level.
Bullish & Bearish Structure Breaks
Clearly distinguishes between bullish and bearish structural shifts.
Clean Chart Visualization
Designed to provide clear structural insights without cluttering your chart.
Works Across All Markets & Timeframes
Suitable for Forex, Crypto, Stocks, and Futures on any timeframe.
█ HOW TO USE
Trend Confirmation
A bullish break of structure suggests buyers are in control and the trend may continue upward.
A bearish break of structure suggests sellers are dominating the market.
Continuation Trades
Traders often use BOS signals to confirm that a trend remains intact before entering pullback trades.
Liquidity & Momentum Awareness
Structure breaks frequently occur when liquidity above highs or below lows is taken. This can lead to rapid price movement.
Combine With Other Tools
For best results, use structural breaks alongside other concepts such as:
█ WHY MARKET STRUCTURE MATTERS
Markets move in cycles of accumulation, expansion, retracement, and continuation.
Breaks of structure are often the first sign that the next phase has begun.
By identifying these key moments automatically, Core Structure Break helps traders stay aligned with the underlying market structure instead of reacting emotionally to every price movement.
Core Structure Break is designed to automatically detect Breaks of Structure (BoS) in price action, helping traders quickly identify when the market transitions from one structural phase to another.
A Break of Structure occurs when price moves beyond a previous swing high or swing low, signaling that the current trend may be continuing or shifting. These moments are often where momentum accelerates as liquidity is taken and market participants reposition.
This indicator removes the need to manually track swing points by automatically identifying key structure levels and highlighting when they are broken.
By clearly marking these structural events, traders can better understand trend continuation, potential reversals, and areas where liquidity has likely been taken.
█ FEATURES
Automatic Structure Detection
Identifies important swing highs and lows to define the current market structure.
Break of Structure Signals (BoS)
Highlights when price breaks a previously established structural level.
Bullish & Bearish Structure Breaks
Clearly distinguishes between bullish and bearish structural shifts.
Clean Chart Visualization
Designed to provide clear structural insights without cluttering your chart.
Works Across All Markets & Timeframes
Suitable for Forex, Crypto, Stocks, and Futures on any timeframe.
█ HOW TO USE
Trend Confirmation
A bullish break of structure suggests buyers are in control and the trend may continue upward.
A bearish break of structure suggests sellers are dominating the market.
Continuation Trades
Traders often use BOS signals to confirm that a trend remains intact before entering pullback trades.
Liquidity & Momentum Awareness
Structure breaks frequently occur when liquidity above highs or below lows is taken. This can lead to rapid price movement.
Combine With Other Tools
For best results, use structural breaks alongside other concepts such as:
- Support & Resistance
- Liquidity Sweeps
- Order Blocks
- Fair Value Gaps
- Trend Indicators
█ WHY MARKET STRUCTURE MATTERS
Markets move in cycles of accumulation, expansion, retracement, and continuation.
Breaks of structure are often the first sign that the next phase has begun.
By identifying these key moments automatically, Core Structure Break helps traders stay aligned with the underlying market structure instead of reacting emotionally to every price movement.
リリースノート
Add 'Max Display' to allow customization of number of BoS to display.オープンソーススクリプト
TradingViewの精神に則り、このスクリプトの作者はコードをオープンソースとして公開してくれました。トレーダーが内容を確認・検証できるようにという配慮です。作者に拍手を送りましょう!無料で利用できますが、コードの再公開はハウスルールに従う必要があります。

免責事項
これらの情報および投稿は、TradingViewが提供または承認する金融、投資、取引、またはその他の種類の助言もしくは推奨であることを意図したものではなく、またこれらに該当するものでもありません。詳細は利用規約をご覧ください。
オープンソーススクリプト
TradingViewの精神に則り、このスクリプトの作者はコードをオープンソースとして公開してくれました。トレーダーが内容を確認・検証できるようにという配慮です。作者に拍手を送りましょう!無料で利用できますが、コードの再公開はハウスルールに従う必要があります。
免責事項
これらの情報および投稿は、TradingViewが提供または承認する金融、投資、取引、またはその他の種類の助言もしくは推奨であることを意図したものではなく、またこれらに該当するものでもありません。詳細は利用規約をご覧ください。