OPEN-SOURCE SCRIPT
Advanced Multi-RSI Momentum System
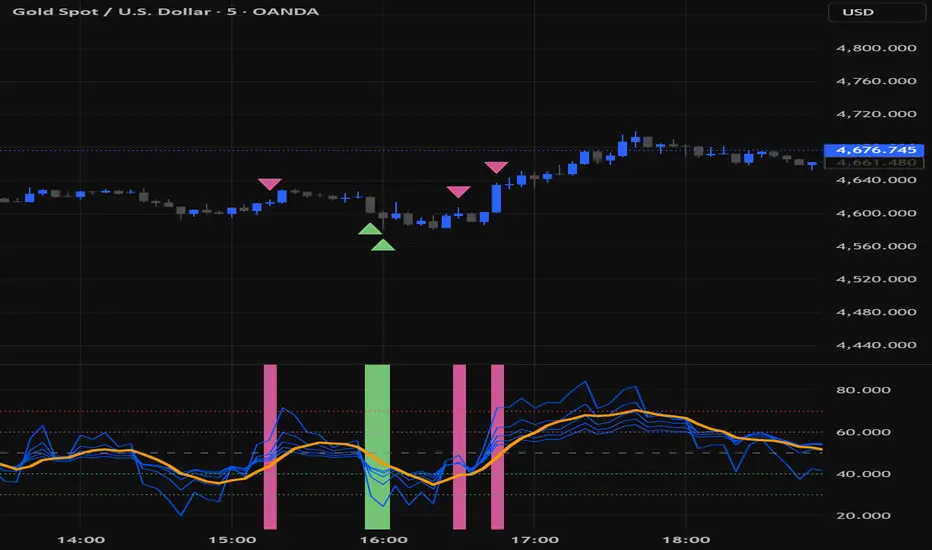
Advanced Multi-RSI Momentum System
This indicator is an enhanced version of multi-timeframe RSI analysis that combines five different RSI periods (7, 14, 21, 28, 35) with a Zero-Lag EMA to create a more responsive and reliable momentum oscillator.
What makes it different:
- Uses a weighted combination of multiple RSI lengths to reduce false signals common in single RSI indicators.
- Zero-Lag smoothing on the average RSI for faster reaction to momentum shifts.
- Intelligent color-coded background system that clearly shows:
• Early momentum signals
• Confirmation signals
• Momentum fading zones
• Consolidation phases (potential breakout setups)
- Clean triangle markers placed directly on the price chart for quick visual reference of buy and sell zones.
How it works:
The script calculates five RSIs with different sensitivities, takes their average, applies Zero-Lag EMA, and then uses specific crossover logic between the RSIs to detect shifts in momentum strength. Consolidation is detected by analyzing both price range and RSI range simultaneously.
Best used on 1H and 4H timeframes for swing and intraday trading.
All colors are fully customizable.
This is not just another RSI indicator — it's a complete momentum analysis system designed to help traders spot high-probability entries, exits, and consolidation breakouts with greater clarity.
Haschemi
This indicator is an enhanced version of multi-timeframe RSI analysis that combines five different RSI periods (7, 14, 21, 28, 35) with a Zero-Lag EMA to create a more responsive and reliable momentum oscillator.
What makes it different:
- Uses a weighted combination of multiple RSI lengths to reduce false signals common in single RSI indicators.
- Zero-Lag smoothing on the average RSI for faster reaction to momentum shifts.
- Intelligent color-coded background system that clearly shows:
• Early momentum signals
• Confirmation signals
• Momentum fading zones
• Consolidation phases (potential breakout setups)
- Clean triangle markers placed directly on the price chart for quick visual reference of buy and sell zones.
How it works:
The script calculates five RSIs with different sensitivities, takes their average, applies Zero-Lag EMA, and then uses specific crossover logic between the RSIs to detect shifts in momentum strength. Consolidation is detected by analyzing both price range and RSI range simultaneously.
Best used on 1H and 4H timeframes for swing and intraday trading.
All colors are fully customizable.
This is not just another RSI indicator — it's a complete momentum analysis system designed to help traders spot high-probability entries, exits, and consolidation breakouts with greater clarity.
Haschemi
オープンソーススクリプト
TradingViewの精神に則り、このスクリプトの作者はコードをオープンソースとして公開してくれました。トレーダーが内容を確認・検証できるようにという配慮です。作者に拍手を送りましょう!無料で利用できますが、コードの再公開はハウスルールに従う必要があります。

免責事項
これらの情報および投稿は、TradingViewが提供または承認する金融、投資、取引、またはその他の種類の助言もしくは推奨であることを意図したものではなく、またこれらに該当するものでもありません。詳細は利用規約をご覧ください。
オープンソーススクリプト
TradingViewの精神に則り、このスクリプトの作者はコードをオープンソースとして公開してくれました。トレーダーが内容を確認・検証できるようにという配慮です。作者に拍手を送りましょう!無料で利用できますが、コードの再公開はハウスルールに従う必要があります。
免責事項
これらの情報および投稿は、TradingViewが提供または承認する金融、投資、取引、またはその他の種類の助言もしくは推奨であることを意図したものではなく、またこれらに該当するものでもありません。詳細は利用規約をご覧ください。