OPEN-SOURCE SCRIPT
F54 Dividends
F54 Dividends
Overview
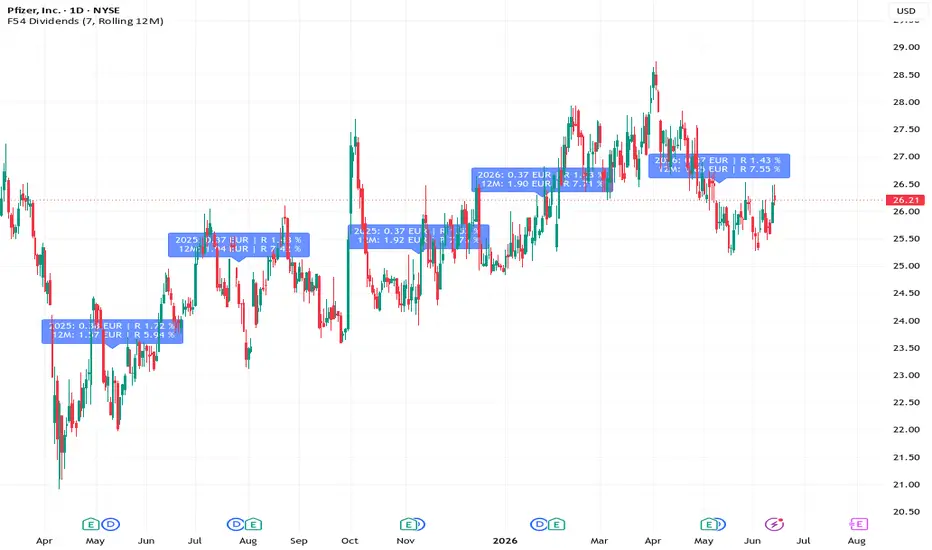
F54 Dividends is an informational indicator that visualises cash dividend events for the active symbol and shows event-level plus cumulative dividend context directly on the chart.
The script is designed for analysis and transparency of dividend history. It does not place orders and does not provide trade execution logic.
Why This Indicator Is Useful
Dividend income is a core component of total return for income-oriented investors, yet TradingView's default chart view gives no direct visibility into it. This indicator bridges that gap.
Together these features let you assess a symbol's income quality and consistency directly on the price chart, supporting dividend-focused screening, position review, and historical context gathering.
What The Indicator Shows
- Detects ex-dividend events from TradingView dividend data.
- Displays per-event dividend amount in EUR.
- Displays per-event dividend ratio relative to a reference close.
- Displays cumulative dividend amount and cumulative dividend ratio according to the selected accumulation mode.
- Limits visible labels to the most recent N events to keep the chart readable.
Accumulation Modes
- YTD: Resets cumulative values at the start of each calendar year.
- Fixed 12M: Uses a fixed 12-month period anchored by the current month.
- Rolling 12M: Uses a continuously rolling 365-day window.
Inputs
- Show last N labels: Controls how many recent dividend labels remain visible.
- Accumulation mode: Selects how cumulative values are calculated (YTD, Fixed 12M, Rolling 12M).
How To Read Labels
Each label includes:
- Dividend amount for the current ex-day.
- Event ratio (R) for the current ex-day.
- Cumulative amount for the selected period.
- Cumulative ratio (R) for the selected period.
- In YTD and Fixed 12M modes, the start of a new accumulation period is highlighted with a teal label.
Notes And Limitations
- Output depends on TradingView dividend data availability and symbol coverage.
- Currency display is EUR in this script configuration.
- Label visibility may vary with chart scaling and timeframe.
- In Rolling 12M mode, accumulated values are window-based and may fall when older ex-dividend events leave the 12-month window, which can be confusing if a steadily increasing total is expected.
- Past data can be revised by data providers; values are informational.
Compliance And Disclaimer
This script is for educational and informational purposes only.
It is not investment advice, not a solicitation, and not a guarantee of future results.
Always perform your own research and risk assessment before making investment decisions.
Overview
F54 Dividends is an informational indicator that visualises cash dividend events for the active symbol and shows event-level plus cumulative dividend context directly on the chart.
The script is designed for analysis and transparency of dividend history. It does not place orders and does not provide trade execution logic.
Why This Indicator Is Useful
Dividend income is a core component of total return for income-oriented investors, yet TradingView's default chart view gives no direct visibility into it. This indicator bridges that gap.
- Yield on cost at a glance. Each label shows the dividend ratio relative to the price at the time of the ex-dividend event, so you can immediately see how yield evolved over time as the share price changed.
- Cumulative income picture. The YTD, Fixed 12M, and Rolling 12M accumulation modes let you see how much income a position has generated over a meaningful period without switching to a separate data source or spreadsheet.
- Pattern recognition. Seeing dividend events overlaid on price action makes it easy to spot payout consistency, growth trends, or cuts alongside the price history that accompanied them.
- Monthly vs quarterly discrimination. The script automatically detects likely monthly payers and suppresses per-event noise, showing only quarter-end summaries to keep the chart readable without losing the cumulative picture.
- Period boundary awareness. New accumulation periods (calendar year or 12-month anchor) are highlighted with a distinct label colour, so resets are immediately visible rather than hidden in the data.
Together these features let you assess a symbol's income quality and consistency directly on the price chart, supporting dividend-focused screening, position review, and historical context gathering.
What The Indicator Shows
- Detects ex-dividend events from TradingView dividend data.
- Displays per-event dividend amount in EUR.
- Displays per-event dividend ratio relative to a reference close.
- Displays cumulative dividend amount and cumulative dividend ratio according to the selected accumulation mode.
- Limits visible labels to the most recent N events to keep the chart readable.
Accumulation Modes
- YTD: Resets cumulative values at the start of each calendar year.
- Fixed 12M: Uses a fixed 12-month period anchored by the current month.
- Rolling 12M: Uses a continuously rolling 365-day window.
Inputs
- Show last N labels: Controls how many recent dividend labels remain visible.
- Accumulation mode: Selects how cumulative values are calculated (YTD, Fixed 12M, Rolling 12M).
How To Read Labels
Each label includes:
- Dividend amount for the current ex-day.
- Event ratio (R) for the current ex-day.
- Cumulative amount for the selected period.
- Cumulative ratio (R) for the selected period.
- In YTD and Fixed 12M modes, the start of a new accumulation period is highlighted with a teal label.
Notes And Limitations
- Output depends on TradingView dividend data availability and symbol coverage.
- Currency display is EUR in this script configuration.
- Label visibility may vary with chart scaling and timeframe.
- In Rolling 12M mode, accumulated values are window-based and may fall when older ex-dividend events leave the 12-month window, which can be confusing if a steadily increasing total is expected.
- Past data can be revised by data providers; values are informational.
Compliance And Disclaimer
This script is for educational and informational purposes only.
It is not investment advice, not a solicitation, and not a guarantee of future results.
Always perform your own research and risk assessment before making investment decisions.
オープンソーススクリプト
TradingViewの精神に則り、このスクリプトの作者はコードをオープンソースとして公開してくれました。トレーダーが内容を確認・検証できるようにという配慮です。作者に拍手を送りましょう!無料で利用できますが、コードの再公開はハウスルールに従う必要があります。

免責事項
これらの情報および投稿は、TradingViewが提供または承認する金融、投資、取引、またはその他の種類の助言もしくは推奨であることを意図したものではなく、またこれらに該当するものでもありません。詳細は利用規約をご覧ください。
オープンソーススクリプト
TradingViewの精神に則り、このスクリプトの作者はコードをオープンソースとして公開してくれました。トレーダーが内容を確認・検証できるようにという配慮です。作者に拍手を送りましょう!無料で利用できますが、コードの再公開はハウスルールに従う必要があります。
免責事項
これらの情報および投稿は、TradingViewが提供または承認する金融、投資、取引、またはその他の種類の助言もしくは推奨であることを意図したものではなく、またこれらに該当するものでもありません。詳細は利用規約をご覧ください。