OPEN-SOURCE SCRIPT
更新済 Cumulative Volume Delta
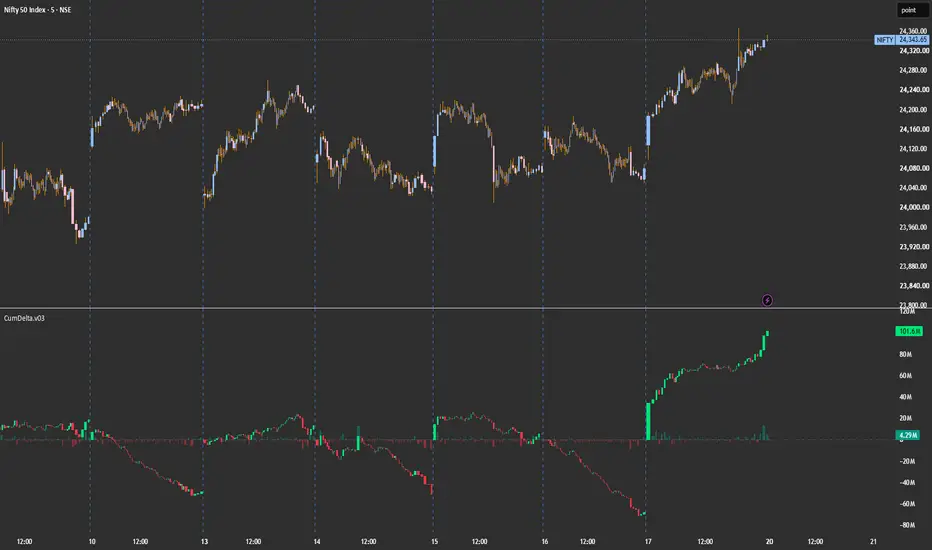
CumDelta — Cumulative Volume Delta with Session Reset
A clean cumulative volume delta (CVD) indicator that visualizes the running balance of buying vs. selling aggression using lower-timeframe up/down volume. Designed for intraday traders who want to read order flow alongside price.
What it does
Each bar's delta is calculated by pulling lower-timeframe volume data and classifying it as buying or selling pressure based on whether each sub-bar closed up or down. These per-bar deltas are then cumulated into a running total that resets on your chosen schedule (day, session, week, month, year, or N bars back).
The cumulative delta is rendered as candles — each candle's open chains from the previous close, and the body shows whether net flow on that bar was positive or negative. A histogram below shows the raw per-bar delta for quick reference.
How to read it
Rising green candles — sustained buying pressure
Falling red candles — sustained selling pressure
Divergence vs. price — price makes a new high but CVD doesn't (or vice versa) often precedes reversals
Reset bars (optional yellow highlight) — fresh session start, useful for marking where the cumulation restarts
Settings
Reset Period — Day, Session (RTH-aware), Week, Month, Year, or Bars Back
Lower Timeframe — auto-selects based on chart TF, or set manually for finer/coarser resolution
Doji Handling — choose how to attribute volume when a bar closes flat (Split 50/50, Up, Down, or Skip)
Display toggles — bar delta histogram, cumulative candles, reset markers
A clean cumulative volume delta (CVD) indicator that visualizes the running balance of buying vs. selling aggression using lower-timeframe up/down volume. Designed for intraday traders who want to read order flow alongside price.
What it does
Each bar's delta is calculated by pulling lower-timeframe volume data and classifying it as buying or selling pressure based on whether each sub-bar closed up or down. These per-bar deltas are then cumulated into a running total that resets on your chosen schedule (day, session, week, month, year, or N bars back).
The cumulative delta is rendered as candles — each candle's open chains from the previous close, and the body shows whether net flow on that bar was positive or negative. A histogram below shows the raw per-bar delta for quick reference.
How to read it
Rising green candles — sustained buying pressure
Falling red candles — sustained selling pressure
Divergence vs. price — price makes a new high but CVD doesn't (or vice versa) often precedes reversals
Reset bars (optional yellow highlight) — fresh session start, useful for marking where the cumulation restarts
Settings
Reset Period — Day, Session (RTH-aware), Week, Month, Year, or Bars Back
Lower Timeframe — auto-selects based on chart TF, or set manually for finer/coarser resolution
Doji Handling — choose how to attribute volume when a bar closes flat (Split 50/50, Up, Down, or Skip)
Display toggles — bar delta histogram, cumulative candles, reset markers
リリースノート
-Bug Fixオープンソーススクリプト
TradingViewの精神に則り、このスクリプトの作者はコードをオープンソースとして公開してくれました。トレーダーが内容を確認・検証できるようにという配慮です。作者に拍手を送りましょう!無料で利用できますが、コードの再公開はハウスルールに従う必要があります。

免責事項
これらの情報および投稿は、TradingViewが提供または承認する金融、投資、取引、またはその他の種類の助言もしくは推奨であることを意図したものではなく、またこれらに該当するものでもありません。詳細は利用規約をご覧ください。
オープンソーススクリプト
TradingViewの精神に則り、このスクリプトの作者はコードをオープンソースとして公開してくれました。トレーダーが内容を確認・検証できるようにという配慮です。作者に拍手を送りましょう!無料で利用できますが、コードの再公開はハウスルールに従う必要があります。
免責事項
これらの情報および投稿は、TradingViewが提供または承認する金融、投資、取引、またはその他の種類の助言もしくは推奨であることを意図したものではなく、またこれらに該当するものでもありません。詳細は利用規約をご覧ください。