OPEN-SOURCE SCRIPT
Bollinger MTF
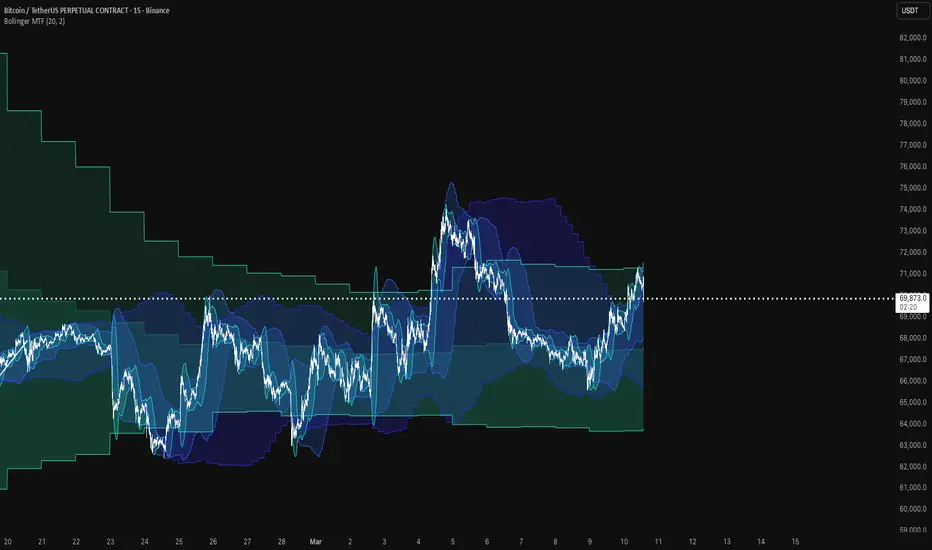
The Bollinger MTF indicator is a versatile volatility and trend analysis tool that allows traders to overlay Bollinger Bands from multiple timeframes onto a single chart. This provides a comprehensive view of market structure, identifying key support and resistance levels across various durations—from intraday scalping ranges to long-term institutional cycles.
By centralizing multi-timeframe (MTF) Bollinger Bands, this indicator eliminates the need to switch tabs constantly, allowing for better alignment checks and regime identification.
█ WHAT MAKES THIS ORIGINAL
1. Comprehensive MTF Integration
Unlike standard Bollinger Band indicators that only show a single timeframe, this tool supports up to seven simultaneous overlays:
- Chart BB: Matches the current chart resolution.
- Intraday: 15-minute and 1-hour.
- Swing: 4-hour and Daily.
- Macro: Weekly and Monthly.
2. Dynamic High-Visibility Design
Each timeframe is assigned a distinct, curated color palette with adjustable fills. This allows for clear "nesting" of bands, making it easy to identify when price is compressed within multiple timeframe extremes or expanding into a broad trend.
3. Optimized Data Fetching
The script uses efficient security calls with `barmerge.gaps_off` to ensure that higher-timeframe data is correctly aligned with the current chart without creating visual distortion or repainting artifacts on historical bars.
█ USAGE
Volatility Compression (Squeeze)
Look for areas where multiple timeframe bands are tightening simultaneously. This indicates a period of low volatility often followed by an explosive move. If the 4h and Daily bands are both squeezing, the subsequent breakout is likely to be significant.
Trend Alignment
A strong trend is often confirmed when price remains positioned between the basis line and the upper/lower bands of multiple timeframes. For example, a "Power Trend" occurs when price respects the 1h BB Upper while staying above the 4h BB Basis.
Mean Reversion Levels
The outer bands of higher timeframes (Daily/Weekly) act as significant exhaustion points. When price reaches a Weekly Band extreme during an intraday move, the probability of a reversal or consolidation increase substantially.
█ DETAILS
Calculation Logic
The core engine utilizes the standard `ta.bb` function, calculating the Simple Moving Average (SMA) and Standard Deviation (StdDev) for each requested timeframe. The results are then synchronized to the current chart using `request.security`.
Display Logic
The script features advanced plotting controls where each timeframe's visibility, color, and center-line display can be toggled independently. This allows for a clean workspace where only the most relevant tiers are visible.
█ SETTINGS
General BB Settings
- Length: The lookback period for the SMA and StdDev calculation (Default: 20).
- StdDev: The multiplier for the bands (Default: 2.0).
Timeframe Toggles
Each timeframe section (Chart, 15m, 1h, 4h, 1d, 1w, 1M) includes:
- Toggle: Enable or disable the specific timeframe.
- Colors: Independent selection for lines and fills.
- Center Line: Optional toggle to show the basis (SMA) line.
█ DISCLAIMER
This indicator is for informational purposes only and does not constitute financial advice. Trading involves significant risk. Always use a holistic approach that includes risk management and additional technical or fundamental confirmation.
By centralizing multi-timeframe (MTF) Bollinger Bands, this indicator eliminates the need to switch tabs constantly, allowing for better alignment checks and regime identification.
█ WHAT MAKES THIS ORIGINAL
1. Comprehensive MTF Integration
Unlike standard Bollinger Band indicators that only show a single timeframe, this tool supports up to seven simultaneous overlays:
- Chart BB: Matches the current chart resolution.
- Intraday: 15-minute and 1-hour.
- Swing: 4-hour and Daily.
- Macro: Weekly and Monthly.
2. Dynamic High-Visibility Design
Each timeframe is assigned a distinct, curated color palette with adjustable fills. This allows for clear "nesting" of bands, making it easy to identify when price is compressed within multiple timeframe extremes or expanding into a broad trend.
3. Optimized Data Fetching
The script uses efficient security calls with `barmerge.gaps_off` to ensure that higher-timeframe data is correctly aligned with the current chart without creating visual distortion or repainting artifacts on historical bars.
█ USAGE
Volatility Compression (Squeeze)
Look for areas where multiple timeframe bands are tightening simultaneously. This indicates a period of low volatility often followed by an explosive move. If the 4h and Daily bands are both squeezing, the subsequent breakout is likely to be significant.
Trend Alignment
A strong trend is often confirmed when price remains positioned between the basis line and the upper/lower bands of multiple timeframes. For example, a "Power Trend" occurs when price respects the 1h BB Upper while staying above the 4h BB Basis.
Mean Reversion Levels
The outer bands of higher timeframes (Daily/Weekly) act as significant exhaustion points. When price reaches a Weekly Band extreme during an intraday move, the probability of a reversal or consolidation increase substantially.
█ DETAILS
Calculation Logic
The core engine utilizes the standard `ta.bb` function, calculating the Simple Moving Average (SMA) and Standard Deviation (StdDev) for each requested timeframe. The results are then synchronized to the current chart using `request.security`.
Display Logic
The script features advanced plotting controls where each timeframe's visibility, color, and center-line display can be toggled independently. This allows for a clean workspace where only the most relevant tiers are visible.
█ SETTINGS
General BB Settings
- Length: The lookback period for the SMA and StdDev calculation (Default: 20).
- StdDev: The multiplier for the bands (Default: 2.0).
Timeframe Toggles
Each timeframe section (Chart, 15m, 1h, 4h, 1d, 1w, 1M) includes:
- Toggle: Enable or disable the specific timeframe.
- Colors: Independent selection for lines and fills.
- Center Line: Optional toggle to show the basis (SMA) line.
█ DISCLAIMER
This indicator is for informational purposes only and does not constitute financial advice. Trading involves significant risk. Always use a holistic approach that includes risk management and additional technical or fundamental confirmation.
オープンソーススクリプト
TradingViewの精神に則り、このスクリプトの作者はコードをオープンソースとして公開してくれました。トレーダーが内容を確認・検証できるようにという配慮です。作者に拍手を送りましょう!無料で利用できますが、コードの再公開はハウスルールに従う必要があります。

免責事項
これらの情報および投稿は、TradingViewが提供または承認する金融、投資、取引、またはその他の種類の助言もしくは推奨であることを意図したものではなく、またこれらに該当するものでもありません。詳細は利用規約をご覧ください。
オープンソーススクリプト
TradingViewの精神に則り、このスクリプトの作者はコードをオープンソースとして公開してくれました。トレーダーが内容を確認・検証できるようにという配慮です。作者に拍手を送りましょう!無料で利用できますが、コードの再公開はハウスルールに従う必要があります。
免責事項
これらの情報および投稿は、TradingViewが提供または承認する金融、投資、取引、またはその他の種類の助言もしくは推奨であることを意図したものではなく、またこれらに該当するものでもありません。詳細は利用規約をご覧ください。