OPEN-SOURCE SCRIPT
Institutional Breakouts Channel
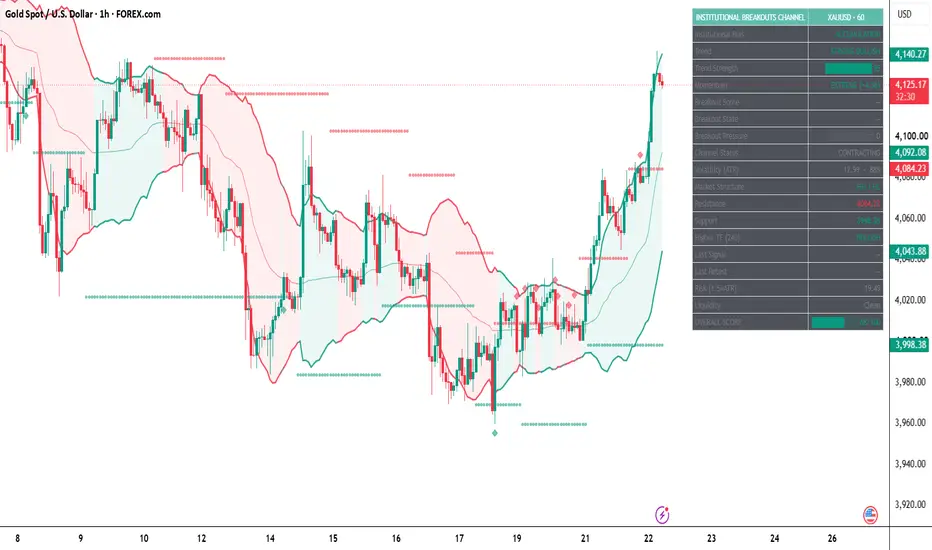
Institutional Breakouts Channel
tradingview.com/u/Forex_Market_Insights/
**Institutional Breakouts Channel** is a professional market structure and breakout analysis indicator designed to help traders identify institutional accumulation, distribution, breakout opportunities, trend continuation, and dynamic support/resistance levels in real time. Instead of relying on a single technical calculation, the indicator combines adaptive price channels, volatility analysis, trend filtering, market structure evaluation, breakout validation, and institutional bias calculations into one comprehensive trading framework.
The primary objective of this indicator is to simplify institutional price behavior by converting complex market movements into an easy-to-read visual environment. It continuously evaluates trend direction, price compression, breakout probability, channel expansion, momentum strength, and market volatility while displaying these conditions directly on the chart.
Institutional Breakouts Channel is designed for traders who want a clean chart without sacrificing analytical depth. It automatically adapts to changing market conditions and remains effective across Forex, Stocks, Indices, Commodities, Metals, Futures, Cryptocurrency, and other TradingView-supported markets.
Unlike traditional breakout indicators that simply highlight when price exceeds previous highs or lows, Institutional Breakouts Channel attempts to evaluate the quality of every breakout using multiple internal conditions before confirming market direction.
---
# What is this Indicator?
Institutional Breakouts Channel is a dynamic trend-following and breakout confirmation indicator that visualizes institutional trading activity through adaptive price channels.
The indicator continuously builds a flexible channel around market price while analyzing:
• Institutional buying pressure
• Institutional selling pressure
• Trend continuation
• Trend exhaustion
• Breakout probability
• Volatility expansion
• Momentum acceleration
• Market structure changes
Instead of showing static support and resistance levels, the channel constantly adjusts itself according to current market conditions, making it suitable for both trending and ranging environments.
The indicator is designed to provide traders with a complete overview of market behavior without requiring multiple separate indicators.
---
# How Does the Indicator Work?
Institutional Breakouts Channel continuously evaluates market data candle by candle.
Its internal calculations monitor the interaction between price movement, volatility, momentum, channel width, trend strength, and market structure.
The adaptive channel automatically expands when volatility increases and contracts when price enters consolidation.
When price begins to accumulate energy inside the channel, the indicator identifies the possibility of an upcoming breakout.
If multiple internal conditions confirm that institutional buying pressure is increasing, the channel gradually shifts into a bullish environment.
Similarly, when selling pressure dominates, the channel transitions into a bearish environment.
The indicator avoids reacting to every minor market fluctuation by applying additional filters designed to reduce unnecessary noise and improve signal quality.
As market conditions evolve, every component of the indicator updates automatically in real time without requiring manual intervention.
---
# What Does the Indicator Display?
Institutional Breakouts Channel combines multiple analytical components into one complete trading environment.
### Dynamic Institutional Price Channel
The indicator draws an adaptive upper and lower channel that continuously follows institutional price movement.
The channel automatically changes shape according to market volatility and trend strength.
---
### Bullish and Bearish Trend Zones
The background channel visually distinguishes bullish and bearish market conditions.
Bullish environments are displayed using supportive colors while bearish environments highlight potential selling pressure.
These visual zones help traders quickly recognize the dominant market direction.
---
### Breakout Detection
The indicator continuously monitors price interaction with the adaptive channel.
Whenever price attempts to escape consolidation, the indicator evaluates whether the move qualifies as a genuine breakout or a potential false breakout.
---
### Breakout Confirmation Levels
Support and resistance areas generated from institutional calculations are displayed automatically.
These levels assist traders in identifying:
• Breakout locations
• Retest opportunities
• Trend continuation zones
• Reversal areas
---
### Institutional Bias Analysis
The indicator calculates the current institutional bias based on multiple internal market conditions.
Possible market states include:
• Bullish
• Bearish
• Neutral
• Accumulation
• Distribution
This helps traders understand the dominant market sentiment.
---
### Market Structure Evaluation
Institutional Breakouts Channel continuously evaluates higher highs, lower highs, higher lows, lower lows, and structural shifts.
This allows traders to understand whether the current market is strengthening or weakening.
---
### Trend Strength Analysis
Rather than simply identifying trend direction, the indicator estimates trend quality.
This helps traders differentiate between:
• Weak trends
• Healthy trends
• Strong institutional trends
• Exhausted trends
---
### Momentum Monitoring
The indicator tracks the acceleration and deceleration of market momentum.
Momentum analysis helps traders determine whether the current breakout is likely to continue or lose strength.
---
### Volatility Analysis
ATR-based calculations estimate current market volatility.
The channel automatically adapts to changing volatility without requiring manual adjustment.
---
### Higher Timeframe Confirmation
Additional higher timeframe analysis helps traders align lower timeframe entries with larger market trends.
This improves overall market context.
---
### Dynamic Support and Resistance
Instead of static horizontal levels, the indicator continuously updates support and resistance according to institutional market behavior.
These levels evolve alongside price.
---
### Institutional Dashboard
The integrated dashboard summarizes important market information including:
• Institutional Bias
• Trend Direction
• Trend Strength
• Momentum
• Breakout Score
• Breakout State
• Breakout Pressure
• Channel Status
• ATR Volatility
• Market Structure
• Dynamic Resistance
• Dynamic Support
• Higher Timeframe Bias
• Last Signal
• Last Retest
• Risk Estimate
• Liquidity Status
• Overall Institutional Score
This dashboard provides a quick overview of current market conditions without requiring additional indicators.
---
# Purpose of the Indicator
The primary purpose of Institutional Breakouts Channel is to simplify institutional market analysis while helping traders identify high-quality breakout opportunities.
Rather than overwhelming users with multiple technical indicators, everything is consolidated into one integrated analytical framework.
The indicator was designed to help traders:
• Identify institutional trend direction.
• Detect potential breakout opportunities.
• Monitor volatility changes.
• Recognize market accumulation.
• Recognize market distribution.
• Follow trend continuation.
• Avoid low-quality breakouts.
• Analyze market structure.
• Improve decision-making using objective market data.
---
# Markets Supported
Institutional Breakouts Channel has been designed to operate across virtually every liquid financial market available on TradingView.
These include:
• Forex
• Cryptocurrency
• Stocks
• Indices
• Commodities
• Precious Metals
• Futures
• CFDs
• ETFs
The adaptive calculations automatically adjust to different market behaviors without requiring separate versions.
---
# Timeframe Compatibility
The indicator is fully compatible with all TradingView chart timeframes, including:
• 1 Minute
• 3 Minute
• 5 Minute
• 15 Minute
• 30 Minute
• 1 Hour
• 2 Hour
• 4 Hour
• Daily
• Weekly
• Monthly
Because the calculations are adaptive, the indicator scales naturally across lower and higher timeframes.
---
# How to Interpret the Indicator
The easiest way to understand Institutional Breakouts Channel is by viewing it as a complete institutional trading environment rather than a simple signal generator.
When the channel begins expanding alongside increasing momentum and strengthening trend conditions, the market is generally entering a stronger directional phase.
When the channel contracts, volatility decreases, and breakout pressure weakens, the market may be entering consolidation.
The dashboard should be interpreted as a confirmation tool rather than a standalone trading system. Strong institutional alignment across multiple metrics generally provides greater confidence than relying on any single value.
The adaptive support and resistance levels can also serve as potential reaction zones where traders may monitor price behavior for continuation or rejection.
As with any technical analysis tool, Institutional Breakouts Channel is most effective when combined with disciplined risk management, proper market context, and sound trading practices.
---
# Author Verification & Original Implementation Declaration
**Author Verification**
This indicator has been independently researched, designed, engineered, and implemented by **Forex_Market_Insights**. Every component of the script has been developed as part of an original analytical framework focused on institutional market behavior, adaptive breakout analysis, dynamic channel construction, and real-time trend evaluation.
---
**Original Implementation Verification**
The published implementation represents an original Pine Script development created specifically for **Institutional Breakouts Channel**. The architecture, internal calculations, visualization methods, dashboard design, adaptive channel logic, breakout evaluation process, market structure interpretation, volatility handling, and overall workflow have been independently implemented as part of this project.
---
**Declaration**
© **Forex_Market_Insights**
All analytical concepts, implementation methods, visualization techniques, script architecture, calculations, dashboard presentation, and indicator workflow contained within this publication are presented as an original implementation created by **Forex_Market_Insights**.
This script is intended solely for educational and analytical purposes. It does not constitute financial or investment advice. Trading financial markets involves substantial risk, and users remain fully responsible for their own trading decisions, risk management, and capital allocation.
tradingview.com/u/Forex_Market_Insights/
tradingview.com/u/Forex_Market_Insights/
**Institutional Breakouts Channel** is a professional market structure and breakout analysis indicator designed to help traders identify institutional accumulation, distribution, breakout opportunities, trend continuation, and dynamic support/resistance levels in real time. Instead of relying on a single technical calculation, the indicator combines adaptive price channels, volatility analysis, trend filtering, market structure evaluation, breakout validation, and institutional bias calculations into one comprehensive trading framework.
The primary objective of this indicator is to simplify institutional price behavior by converting complex market movements into an easy-to-read visual environment. It continuously evaluates trend direction, price compression, breakout probability, channel expansion, momentum strength, and market volatility while displaying these conditions directly on the chart.
Institutional Breakouts Channel is designed for traders who want a clean chart without sacrificing analytical depth. It automatically adapts to changing market conditions and remains effective across Forex, Stocks, Indices, Commodities, Metals, Futures, Cryptocurrency, and other TradingView-supported markets.
Unlike traditional breakout indicators that simply highlight when price exceeds previous highs or lows, Institutional Breakouts Channel attempts to evaluate the quality of every breakout using multiple internal conditions before confirming market direction.
---
# What is this Indicator?
Institutional Breakouts Channel is a dynamic trend-following and breakout confirmation indicator that visualizes institutional trading activity through adaptive price channels.
The indicator continuously builds a flexible channel around market price while analyzing:
• Institutional buying pressure
• Institutional selling pressure
• Trend continuation
• Trend exhaustion
• Breakout probability
• Volatility expansion
• Momentum acceleration
• Market structure changes
Instead of showing static support and resistance levels, the channel constantly adjusts itself according to current market conditions, making it suitable for both trending and ranging environments.
The indicator is designed to provide traders with a complete overview of market behavior without requiring multiple separate indicators.
---
# How Does the Indicator Work?
Institutional Breakouts Channel continuously evaluates market data candle by candle.
Its internal calculations monitor the interaction between price movement, volatility, momentum, channel width, trend strength, and market structure.
The adaptive channel automatically expands when volatility increases and contracts when price enters consolidation.
When price begins to accumulate energy inside the channel, the indicator identifies the possibility of an upcoming breakout.
If multiple internal conditions confirm that institutional buying pressure is increasing, the channel gradually shifts into a bullish environment.
Similarly, when selling pressure dominates, the channel transitions into a bearish environment.
The indicator avoids reacting to every minor market fluctuation by applying additional filters designed to reduce unnecessary noise and improve signal quality.
As market conditions evolve, every component of the indicator updates automatically in real time without requiring manual intervention.
---
# What Does the Indicator Display?
Institutional Breakouts Channel combines multiple analytical components into one complete trading environment.
### Dynamic Institutional Price Channel
The indicator draws an adaptive upper and lower channel that continuously follows institutional price movement.
The channel automatically changes shape according to market volatility and trend strength.
---
### Bullish and Bearish Trend Zones
The background channel visually distinguishes bullish and bearish market conditions.
Bullish environments are displayed using supportive colors while bearish environments highlight potential selling pressure.
These visual zones help traders quickly recognize the dominant market direction.
---
### Breakout Detection
The indicator continuously monitors price interaction with the adaptive channel.
Whenever price attempts to escape consolidation, the indicator evaluates whether the move qualifies as a genuine breakout or a potential false breakout.
---
### Breakout Confirmation Levels
Support and resistance areas generated from institutional calculations are displayed automatically.
These levels assist traders in identifying:
• Breakout locations
• Retest opportunities
• Trend continuation zones
• Reversal areas
---
### Institutional Bias Analysis
The indicator calculates the current institutional bias based on multiple internal market conditions.
Possible market states include:
• Bullish
• Bearish
• Neutral
• Accumulation
• Distribution
This helps traders understand the dominant market sentiment.
---
### Market Structure Evaluation
Institutional Breakouts Channel continuously evaluates higher highs, lower highs, higher lows, lower lows, and structural shifts.
This allows traders to understand whether the current market is strengthening or weakening.
---
### Trend Strength Analysis
Rather than simply identifying trend direction, the indicator estimates trend quality.
This helps traders differentiate between:
• Weak trends
• Healthy trends
• Strong institutional trends
• Exhausted trends
---
### Momentum Monitoring
The indicator tracks the acceleration and deceleration of market momentum.
Momentum analysis helps traders determine whether the current breakout is likely to continue or lose strength.
---
### Volatility Analysis
ATR-based calculations estimate current market volatility.
The channel automatically adapts to changing volatility without requiring manual adjustment.
---
### Higher Timeframe Confirmation
Additional higher timeframe analysis helps traders align lower timeframe entries with larger market trends.
This improves overall market context.
---
### Dynamic Support and Resistance
Instead of static horizontal levels, the indicator continuously updates support and resistance according to institutional market behavior.
These levels evolve alongside price.
---
### Institutional Dashboard
The integrated dashboard summarizes important market information including:
• Institutional Bias
• Trend Direction
• Trend Strength
• Momentum
• Breakout Score
• Breakout State
• Breakout Pressure
• Channel Status
• ATR Volatility
• Market Structure
• Dynamic Resistance
• Dynamic Support
• Higher Timeframe Bias
• Last Signal
• Last Retest
• Risk Estimate
• Liquidity Status
• Overall Institutional Score
This dashboard provides a quick overview of current market conditions without requiring additional indicators.
---
# Purpose of the Indicator
The primary purpose of Institutional Breakouts Channel is to simplify institutional market analysis while helping traders identify high-quality breakout opportunities.
Rather than overwhelming users with multiple technical indicators, everything is consolidated into one integrated analytical framework.
The indicator was designed to help traders:
• Identify institutional trend direction.
• Detect potential breakout opportunities.
• Monitor volatility changes.
• Recognize market accumulation.
• Recognize market distribution.
• Follow trend continuation.
• Avoid low-quality breakouts.
• Analyze market structure.
• Improve decision-making using objective market data.
---
# Markets Supported
Institutional Breakouts Channel has been designed to operate across virtually every liquid financial market available on TradingView.
These include:
• Forex
• Cryptocurrency
• Stocks
• Indices
• Commodities
• Precious Metals
• Futures
• CFDs
• ETFs
The adaptive calculations automatically adjust to different market behaviors without requiring separate versions.
---
# Timeframe Compatibility
The indicator is fully compatible with all TradingView chart timeframes, including:
• 1 Minute
• 3 Minute
• 5 Minute
• 15 Minute
• 30 Minute
• 1 Hour
• 2 Hour
• 4 Hour
• Daily
• Weekly
• Monthly
Because the calculations are adaptive, the indicator scales naturally across lower and higher timeframes.
---
# How to Interpret the Indicator
The easiest way to understand Institutional Breakouts Channel is by viewing it as a complete institutional trading environment rather than a simple signal generator.
When the channel begins expanding alongside increasing momentum and strengthening trend conditions, the market is generally entering a stronger directional phase.
When the channel contracts, volatility decreases, and breakout pressure weakens, the market may be entering consolidation.
The dashboard should be interpreted as a confirmation tool rather than a standalone trading system. Strong institutional alignment across multiple metrics generally provides greater confidence than relying on any single value.
The adaptive support and resistance levels can also serve as potential reaction zones where traders may monitor price behavior for continuation or rejection.
As with any technical analysis tool, Institutional Breakouts Channel is most effective when combined with disciplined risk management, proper market context, and sound trading practices.
---
# Author Verification & Original Implementation Declaration
**Author Verification**
This indicator has been independently researched, designed, engineered, and implemented by **Forex_Market_Insights**. Every component of the script has been developed as part of an original analytical framework focused on institutional market behavior, adaptive breakout analysis, dynamic channel construction, and real-time trend evaluation.
---
**Original Implementation Verification**
The published implementation represents an original Pine Script development created specifically for **Institutional Breakouts Channel**. The architecture, internal calculations, visualization methods, dashboard design, adaptive channel logic, breakout evaluation process, market structure interpretation, volatility handling, and overall workflow have been independently implemented as part of this project.
---
**Declaration**
© **Forex_Market_Insights**
All analytical concepts, implementation methods, visualization techniques, script architecture, calculations, dashboard presentation, and indicator workflow contained within this publication are presented as an original implementation created by **Forex_Market_Insights**.
This script is intended solely for educational and analytical purposes. It does not constitute financial or investment advice. Trading financial markets involves substantial risk, and users remain fully responsible for their own trading decisions, risk management, and capital allocation.
tradingview.com/u/Forex_Market_Insights/
オープンソーススクリプト
TradingViewの精神に則り、このスクリプトの作者はコードをオープンソースとして公開してくれました。トレーダーが内容を確認・検証できるようにという配慮です。作者に拍手を送りましょう!無料で利用できますが、コードの再公開はハウスルールに従う必要があります。

Join My VIP Free Signals Channel.✅
telegram.me/+ZNhfjlhXP3s4OWI1
For Daily LIVE Trades,
Join Free Telegram Channel ✅
telegram.me/+ZNhfjlhXP3s4OWI1
telegram.me/+ZNhfjlhXP3s4OWI1
For Daily LIVE Trades,
Join Free Telegram Channel ✅
telegram.me/+ZNhfjlhXP3s4OWI1
免責事項
これらの情報および投稿は、TradingViewが提供または承認する金融、投資、取引、またはその他の種類の助言もしくは推奨であることを意図したものではなく、またこれらに該当するものでもありません。詳細は利用規約をご覧ください。
オープンソーススクリプト
TradingViewの精神に則り、このスクリプトの作者はコードをオープンソースとして公開してくれました。トレーダーが内容を確認・検証できるようにという配慮です。作者に拍手を送りましょう!無料で利用できますが、コードの再公開はハウスルールに従う必要があります。
Join My VIP Free Signals Channel.✅
telegram.me/+ZNhfjlhXP3s4OWI1
For Daily LIVE Trades,
Join Free Telegram Channel ✅
telegram.me/+ZNhfjlhXP3s4OWI1
telegram.me/+ZNhfjlhXP3s4OWI1
For Daily LIVE Trades,
Join Free Telegram Channel ✅
telegram.me/+ZNhfjlhXP3s4OWI1
免責事項
これらの情報および投稿は、TradingViewが提供または承認する金融、投資、取引、またはその他の種類の助言もしくは推奨であることを意図したものではなく、またこれらに該当するものでもありません。詳細は利用規約をご覧ください。