OPEN-SOURCE SCRIPT
更新済 Campaign Map - Contreras Law
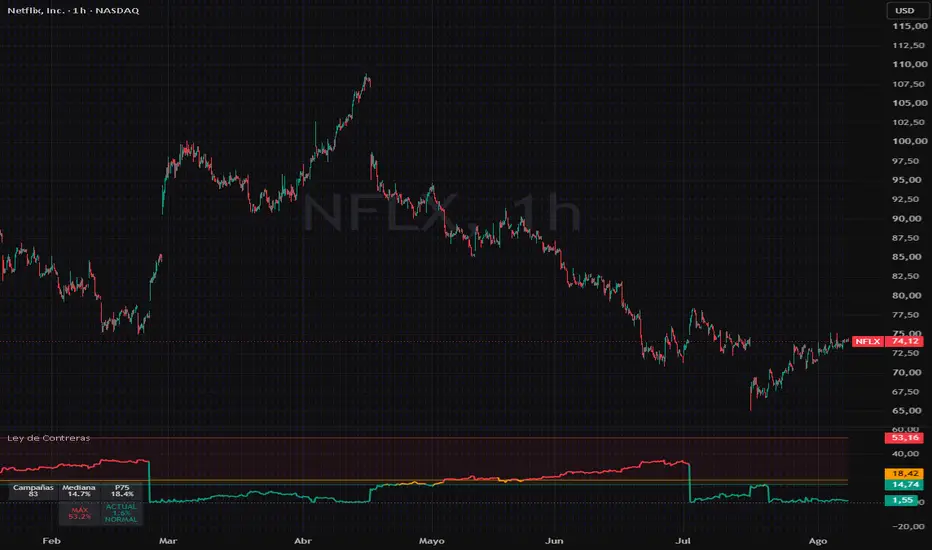
[ES] Version en espanol mas abajo. · [EN] English version first, Spanish below.
─────────────────────────────────
CAMPAIGN MAP — CONTRERAS' LAW
WHAT IT MEASURES
This indicator builds the historical distribution of a symbol's
campaign corrections (peak→trough declines confirmed by reversal) and
places the CURRENT correction inside that map: is it normal breathing,
a deep pullback, or statistically unusual territory?
THE OBSERVATION BEHIND IT
Contreras' Law (Jacinto Contreras, June 2026): in US large-cap
technology stocks, the typical depth of campaign corrections converges
to a structural constant (~14-15% median at campaign scale),
regardless of the symbol. What differentiates each stock is not its
median but its historical maximum tail (observed: from ~25% to ~53%
depending on the symbol, across ~11 years of hourly data on 9 names).
Operational takeaway: MONITOR WITH THE MEDIAN, SIZE WITH THE TAIL.
HOW IT WORKS
· A reversal-threshold zigzag detects campaign peaks and troughs.
· Only COMPLETED corrections (confirmed by reversal) enter the
statistics: median, 75th percentile, and historical maximum.
· The main line plots the depth of the ongoing correction, colored by
zone: normal (teal), deep (orange), unusual (red).
· Summary table with the symbol's map and current status.
· Two alerts: median cross and P75 cross.
HOW TO USE IT
· Below the median: normal breathing; the pullback alone carries no
trend-change information.
· Between median and P75: deep but normal correction.
· Above P75: statistically unusual territory. The correct reading is
NOT "it must bounce now" — it is: look for exhaustion evidence
(divergences, capitulation) and demand confirmation.
· The historical maximum (the tail) is the worst-case reference for
position sizing and campaign stops.
INPUTS
· Reversal (%): rally confirming the end of a bearish campaign.
8% = campaign scale (default). 3% = swing scale.
· Minimum depth (%): smaller corrections are excluded from the map.
10% campaign / 5% swing.
LIMITATIONS (read before use)
· Statistics do NOT repaint (completed corrections only), but the
ONGOING correction is provisional by nature: its campaign peak may
extend until the reversal confirms.
· The median convergence was observed in US large-cap tech on the
hourly timeframe; it may not hold in other sectors, assets or
timeframes. Verify it on your symbol before relying on it.
· Enough campaigns (>8-10) are required for the map to be
statistically meaningful; the indicator shows "calibrating…" until
then.
· This is a MEASUREMENT and context tool. It does not generate buy or
sell signals and guarantees no outcome. Not financial advice.
─────────────────────────────────
VERSIÓN EN ESPAÑOL
MAPA DE CAMPAÑAS — LEY DE CONTRERAS
QUÉ MIDE
Este indicador construye la distribución histórica de las correcciones
de campaña de un valor (caídas máximo→mínimo confirmadas por reversión)
y sitúa la corrección actual dentro de ese mapa: ¿es una respiración
normal, una corrección profunda o territorio inusual?
LA OBSERVACIÓN QUE LO ORIGINA
Ley de Contreras (Jacinto Contreras, junio de 2026): en valores
tecnológicos estadounidenses de alta capitalización, la profundidad
típica de las correcciones de campaña converge en una constante
estructural (~14-15% de mediana, escala campaña), independiente del
símbolo. Lo que diferencia a cada valor no es su mediana, sino su cola
máxima histórica (observado: desde ~25% hasta ~53% según el símbolo,
sobre ~11 años de datos horarios en 9 valores).
Moraleja operativa: VIGILAR CON LA MEDIANA, DIMENSIONAR CON LA COLA.
CÓMO FUNCIONA
· Un zigzag por umbral de reversión detecta picos y valles de campaña.
· Solo las correcciones COMPLETADAS (confirmadas por reversión) entran
en la estadística: mediana, percentil 75 y máximo histórico.
· La línea principal muestra la profundidad de la corrección en curso,
coloreada según la zona: normal (verde), profunda (naranja),
inusual (rojo).
· Tabla resumen con el mapa del símbolo y el estado actual.
· Dos alertas: cruce de la mediana y cruce del P75.
CÓMO USARLO
· Por debajo de la mediana: respiración normal; el retroceso no es,
por sí solo, información de cambio de tendencia.
· Entre mediana y P75: corrección profunda pero dentro de lo normal.
· Por encima del P75: territorio estadísticamente inusual. La lectura
correcta no es "ya tiene que rebotar", sino: buscar señales de
agotamiento (divergencias, capitulación) y exigir confirmación.
· El máximo histórico (la cola) es la referencia de peor caso para
dimensionar posición y stops de campaña.
PARÁMETROS
· Reversión (%): rally que confirma el fin de una campaña bajista.
8% = escala campaña (por defecto). 3% = escala swing.
· Profundidad mínima (%): correcciones menores no entran al mapa.
10% campaña / 5% swing.
LIMITACIONES (léelas antes de usar)
· Las estadísticas NO repintan (solo correcciones completadas), pero
la corrección EN CURSO es provisional por naturaleza: su máximo de
campaña puede extenderse hasta que la reversión confirme.
· La convergencia de medianas está observada en tecnológicas USA de
alta capitalización en marco horario; en otros sectores, activos o
marcos puede no cumplirse. Compruébalo en tu símbolo antes de usarlo.
· Se necesitan suficientes campañas (>8-10) para que el mapa tenga
valor estadístico; el indicador muestra "calibrando…" mientras tanto.
· Es una herramienta de MEDICIÓN y contexto. No genera señales de
compra/venta ni garantiza resultado alguno. No es asesoramiento
financiero.
─────────────────────────────────
CAMPAIGN MAP — CONTRERAS' LAW
WHAT IT MEASURES
This indicator builds the historical distribution of a symbol's
campaign corrections (peak→trough declines confirmed by reversal) and
places the CURRENT correction inside that map: is it normal breathing,
a deep pullback, or statistically unusual territory?
THE OBSERVATION BEHIND IT
Contreras' Law (Jacinto Contreras, June 2026): in US large-cap
technology stocks, the typical depth of campaign corrections converges
to a structural constant (~14-15% median at campaign scale),
regardless of the symbol. What differentiates each stock is not its
median but its historical maximum tail (observed: from ~25% to ~53%
depending on the symbol, across ~11 years of hourly data on 9 names).
Operational takeaway: MONITOR WITH THE MEDIAN, SIZE WITH THE TAIL.
HOW IT WORKS
· A reversal-threshold zigzag detects campaign peaks and troughs.
· Only COMPLETED corrections (confirmed by reversal) enter the
statistics: median, 75th percentile, and historical maximum.
· The main line plots the depth of the ongoing correction, colored by
zone: normal (teal), deep (orange), unusual (red).
· Summary table with the symbol's map and current status.
· Two alerts: median cross and P75 cross.
HOW TO USE IT
· Below the median: normal breathing; the pullback alone carries no
trend-change information.
· Between median and P75: deep but normal correction.
· Above P75: statistically unusual territory. The correct reading is
NOT "it must bounce now" — it is: look for exhaustion evidence
(divergences, capitulation) and demand confirmation.
· The historical maximum (the tail) is the worst-case reference for
position sizing and campaign stops.
INPUTS
· Reversal (%): rally confirming the end of a bearish campaign.
8% = campaign scale (default). 3% = swing scale.
· Minimum depth (%): smaller corrections are excluded from the map.
10% campaign / 5% swing.
LIMITATIONS (read before use)
· Statistics do NOT repaint (completed corrections only), but the
ONGOING correction is provisional by nature: its campaign peak may
extend until the reversal confirms.
· The median convergence was observed in US large-cap tech on the
hourly timeframe; it may not hold in other sectors, assets or
timeframes. Verify it on your symbol before relying on it.
· Enough campaigns (>8-10) are required for the map to be
statistically meaningful; the indicator shows "calibrating…" until
then.
· This is a MEASUREMENT and context tool. It does not generate buy or
sell signals and guarantees no outcome. Not financial advice.
─────────────────────────────────
VERSIÓN EN ESPAÑOL
MAPA DE CAMPAÑAS — LEY DE CONTRERAS
QUÉ MIDE
Este indicador construye la distribución histórica de las correcciones
de campaña de un valor (caídas máximo→mínimo confirmadas por reversión)
y sitúa la corrección actual dentro de ese mapa: ¿es una respiración
normal, una corrección profunda o territorio inusual?
LA OBSERVACIÓN QUE LO ORIGINA
Ley de Contreras (Jacinto Contreras, junio de 2026): en valores
tecnológicos estadounidenses de alta capitalización, la profundidad
típica de las correcciones de campaña converge en una constante
estructural (~14-15% de mediana, escala campaña), independiente del
símbolo. Lo que diferencia a cada valor no es su mediana, sino su cola
máxima histórica (observado: desde ~25% hasta ~53% según el símbolo,
sobre ~11 años de datos horarios en 9 valores).
Moraleja operativa: VIGILAR CON LA MEDIANA, DIMENSIONAR CON LA COLA.
CÓMO FUNCIONA
· Un zigzag por umbral de reversión detecta picos y valles de campaña.
· Solo las correcciones COMPLETADAS (confirmadas por reversión) entran
en la estadística: mediana, percentil 75 y máximo histórico.
· La línea principal muestra la profundidad de la corrección en curso,
coloreada según la zona: normal (verde), profunda (naranja),
inusual (rojo).
· Tabla resumen con el mapa del símbolo y el estado actual.
· Dos alertas: cruce de la mediana y cruce del P75.
CÓMO USARLO
· Por debajo de la mediana: respiración normal; el retroceso no es,
por sí solo, información de cambio de tendencia.
· Entre mediana y P75: corrección profunda pero dentro de lo normal.
· Por encima del P75: territorio estadísticamente inusual. La lectura
correcta no es "ya tiene que rebotar", sino: buscar señales de
agotamiento (divergencias, capitulación) y exigir confirmación.
· El máximo histórico (la cola) es la referencia de peor caso para
dimensionar posición y stops de campaña.
PARÁMETROS
· Reversión (%): rally que confirma el fin de una campaña bajista.
8% = escala campaña (por defecto). 3% = escala swing.
· Profundidad mínima (%): correcciones menores no entran al mapa.
10% campaña / 5% swing.
LIMITACIONES (léelas antes de usar)
· Las estadísticas NO repintan (solo correcciones completadas), pero
la corrección EN CURSO es provisional por naturaleza: su máximo de
campaña puede extenderse hasta que la reversión confirme.
· La convergencia de medianas está observada en tecnológicas USA de
alta capitalización en marco horario; en otros sectores, activos o
marcos puede no cumplirse. Compruébalo en tu símbolo antes de usarlo.
· Se necesitan suficientes campañas (>8-10) para que el mapa tenga
valor estadístico; el indicador muestra "calibrando…" mientras tanto.
· Es una herramienta de MEDICIÓN y contexto. No genera señales de
compra/venta ni garantiza resultado alguno. No es asesoramiento
financiero.
リリースノート
Título del indicador corregido: en la primera publicación quedó una cadena mal formada anidada dentro del propio título.
Tabla resumen recolocada a la esquina inferior izquierda en formato
compacto de dos filas, para que deje de solaparse con el logotipo de
TradingView. Las etiquetas de estado se han acortado para ajustarse al
nuevo formato.
Formato numérico corregido: los valores por debajo del 1% mostraban el
decimal sin el cero inicial (",4%" en lugar de "0,4%").
Sin cambios en la lógica, los parámetros, los cálculos, las alertas ni
la salida del indicador. Las estadísticas son idénticas a la versión
anterior.
リリースノート
Gráfico de la publicación actualizado para mostrar tres ciclos completos de campaña con sus dos resets.
Añadida una nota en los comentarios del código: la convergencia de
medianas se observa también en escala diaria (NFLX 1D: 256 campañas,
mediana 15,9%).
Sin cambios en la lógica, los parámetros ni la salida del indicador.
オープンソーススクリプト
TradingViewの精神に則り、このスクリプトの作者はコードをオープンソースとして公開してくれました。トレーダーが内容を確認・検証できるようにという配慮です。作者に拍手を送りましょう!無料で利用できますが、コードの再公開はハウスルールに従う必要があります。

免責事項
これらの情報および投稿は、TradingViewが提供または承認する金融、投資、取引、またはその他の種類の助言もしくは推奨であることを意図したものではなく、またこれらに該当するものでもありません。詳細は利用規約をご覧ください。
オープンソーススクリプト
TradingViewの精神に則り、このスクリプトの作者はコードをオープンソースとして公開してくれました。トレーダーが内容を確認・検証できるようにという配慮です。作者に拍手を送りましょう!無料で利用できますが、コードの再公開はハウスルールに従う必要があります。
免責事項
これらの情報および投稿は、TradingViewが提供または承認する金融、投資、取引、またはその他の種類の助言もしくは推奨であることを意図したものではなく、またこれらに該当するものでもありません。詳細は利用規約をご覧ください。