OPEN-SOURCE SCRIPT
Liquidity Magnet [FEELS]
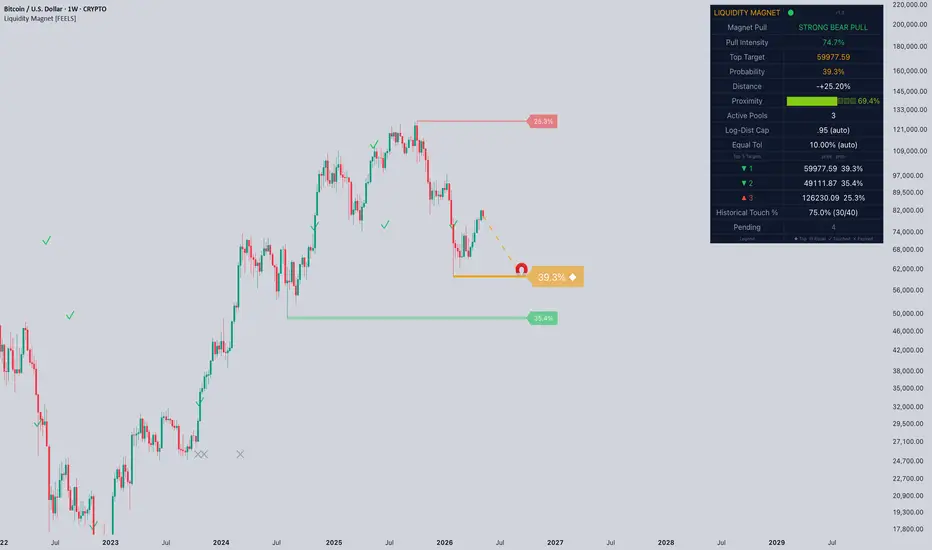
A scoring engine for liquidity zones. Every active pool (swing high,
swing low, or equal-level cluster) gets ranked by probability of being
reached. The highest-probability zone is marked as the top magnet —
the single most likely target right now.
OVERVIEW
Liquidity Magnet is a composite probability scoring system for liquidity zones —
the price levels where resting orders cluster around swing highs, swing lows,
and equal levels. The script ranks every active zone by likelihood of being
reached by price and highlights the single most probable target as the
"top magnet". This is a probabilistic analysis tool, not a predictive signal
generator.
WHAT MAKES IT ORIGINAL
Most existing liquidity tools simply plot pivots or equal highs/lows as static
lines. This script does three things differently:
1. Probability ranking, not binary detection.
Each zone receives a composite score from four independent factors and is
converted into a percentage probability relative to all other active zones.
The result is a relative ranking instead of an undifferentiated list of
levels.
2. Logarithmic distance filtering with timeframe auto-scaling.
Distance to price is measured in log space, which makes the filter
symmetric across price decades. A pool 50% below price has the same
"distance weight" as a pool 50% above. The acceptable distance range
also auto-adjusts to the chart timeframe — weekly charts use a wider
range than 1-minute charts.
3. Transparent track record.
When the top magnet changes, the previous one is recorded and its outcome
tracked over a configurable window. Each historical magnet is marked as
"touched" (price reached it) or "expired" (window passed without reaching).
The dashboard shows the rolling touch rate so users can evaluate the
scoring behavior on the instrument and timeframe they actually trade.
HOW IT WORKS
Liquidity zone detection
The script identifies confirmed swing highs and swing lows using a
configurable pivot lookback. Pivots in the same direction that fall within
a tolerance band are merged into a single "equal liquidity" zone. The
tolerance band auto-scales to timeframe (wider on higher timeframes where
each bar covers more range, narrower on intraday).
Composite probability score
Every active zone receives a raw score combining four weighted components:
- Strength: volume at the pivot bar normalized against a 50-bar volume SMA,
multiplied by a clustering bonus if the zone was formed by merged pivots.
- Proximity: an inverted-U curve over the logarithmic distance to price,
peaking around 2% from current price and decaying symmetrically in both
directions.
- Age: a maturity curve. Very fresh zones are discounted (the market has
not had time to confirm them), mature zones get full weight, and very
old zones decay gradually.
- Momentum: a directional alignment factor. If short-term EMA momentum
points toward a zone, that zone's score is boosted; if momentum points
away, the score is reduced.
All zone scores are then divided by their sum to produce a probability
percentage. The highest-percentage zone is the top magnet.
Magnet Pull direction
The dashboard's Magnet Pull metric reports the direction toward the top
magnet (bullish if the top zone is above price, bearish if below), weighted
by the share of total score on that side. This is a direction indicator,
not a momentum signal.
Pruning
Zones are removed when one of three things happens: price reaches the zone
(swept), the zone exceeds the maximum age in bars, or the zone moves outside
the log-distance filter as price evolves.
HOW TO USE IT
The intended workflow is contextual, not signal-based:
1. Open the chart on your trading timeframe. Auto-scale picks reasonable
defaults for clustering tolerance and distance filter; both can be
overridden manually.
2. Read the dashboard. The top target price and probability give you the
single most likely magnet. The Magnet Pull and Pull Intensity describe
directional bias. The proximity progress bar shows how close price
currently is to the top magnet in log space.
3. Use Top 3 targets for alternatives. The probability gap between rank 1
and ranks 2-3 tells you how dominant the top magnet is. A 40% / 38% /
22% spread is much less decisive than a 60% / 25% / 15% spread.
4. Enable Historical Track to evaluate behavior. Past top magnets are
marked with their outcome on the chart. The rolling Historical Touch %
in the dashboard summarizes the script's recent behavior on the current
instrument and timeframe. This is observational data, not a guarantee.
5. Treat outputs as context, not signals. The script highlights where
liquidity is concentrated and which target the composite model considers
most probable. Trade entries, stop placement, and position sizing remain
the user's responsibility.
PARAMETERS
Pivot Lookback — bars on each side used to confirm a swing point. Higher
values produce fewer but more significant zones.
Equal H/L Tolerance % — clustering threshold. Pivots within this percentage
in the same direction merge into a single zone. Auto-scaled by default.
Log-Distance — maximum allowed distance in log space between price and any
active zone. Auto-scaled by default. Symmetric: covers both above and below
price.
Weight inputs (Strength, Proximity, Age, Momentum) — relative influence of
each scoring component. Default values are calibrated for crypto and equity
intraday/swing usage. Adjusting weights changes the character of the ranking.
Tracking Window (bars) — how long a former top magnet stays "pending" before
being marked as expired.
UI Sizing controls — dashboard position, dashboard text size, zone label
sizes, magnet marker size, historical marker size, all independently
adjustable for personal screen and screenshot preferences.
QUICK START
1. Add the script to any chart
2. Auto-scale handles parameters automatically
3. Look at "Top Target" in the dashboard — that's the most likely magnet
4. Look at "Magnet Pull" — that's the directional bias
5. Turn on "Show Historical Top Magnets" to see past behavior
No setup required. All defaults are calibrated.
TESTED ACROSS
Verified visually on multiple instruments and timeframes:
- Cryptocurrency: BTCUSD, ETHUSD, SOLUSD on 1H to 1W


- Equity indices: NQ, ES on 4H to 1D

- Forex majors: EURUSD, GBPUSD on 1H to 1D

- Commodities: Gold (XAUUSD), Crude Oil on 1D

Auto-scale parameters cover all these instruments and timeframes without
manual tuning. Manual override is available for specific instrument behavior.
NOTES AND LIMITATIONS
- The script is non-repainting on confirmed bars. Pivot detection uses a
fixed forward lookback, which means zones appear after the pivot is
confirmed (lookback bars after the high/low), not in real-time at the
exact bar of the high/low. This is intentional.
- Probability percentages are relative weights inside the active zone set,
not absolute statistical probabilities. They describe the composite
model's ranking, not a calibrated forecast.
- The Historical Touch % is a descriptive statistic over a rolling window.
It reflects observed behavior and does not project future performance.
- Bar Replay is supported: scoring updates on every confirmed bar and
historical markers are placed at the recorded positions, so the chart
behaves consistently when scrubbing through history.
- The script does not generate buy/sell signals. There is no entry/exit
logic, no stop/target output, and no strategy() conversion. It is a
visual analysis tool.
This script is original work. The composite scoring formula, the log-distance
filtering approach, the pool merging algorithm, the directional Magnet Pull
metric, and the historical tracking logic are all custom implementations
written specifically for this script.
swing low, or equal-level cluster) gets ranked by probability of being
reached. The highest-probability zone is marked as the top magnet —
the single most likely target right now.
OVERVIEW
Liquidity Magnet is a composite probability scoring system for liquidity zones —
the price levels where resting orders cluster around swing highs, swing lows,
and equal levels. The script ranks every active zone by likelihood of being
reached by price and highlights the single most probable target as the
"top magnet". This is a probabilistic analysis tool, not a predictive signal
generator.
WHAT MAKES IT ORIGINAL
Most existing liquidity tools simply plot pivots or equal highs/lows as static
lines. This script does three things differently:
1. Probability ranking, not binary detection.
Each zone receives a composite score from four independent factors and is
converted into a percentage probability relative to all other active zones.
The result is a relative ranking instead of an undifferentiated list of
levels.
2. Logarithmic distance filtering with timeframe auto-scaling.
Distance to price is measured in log space, which makes the filter
symmetric across price decades. A pool 50% below price has the same
"distance weight" as a pool 50% above. The acceptable distance range
also auto-adjusts to the chart timeframe — weekly charts use a wider
range than 1-minute charts.
3. Transparent track record.
When the top magnet changes, the previous one is recorded and its outcome
tracked over a configurable window. Each historical magnet is marked as
"touched" (price reached it) or "expired" (window passed without reaching).
The dashboard shows the rolling touch rate so users can evaluate the
scoring behavior on the instrument and timeframe they actually trade.
HOW IT WORKS
Liquidity zone detection
The script identifies confirmed swing highs and swing lows using a
configurable pivot lookback. Pivots in the same direction that fall within
a tolerance band are merged into a single "equal liquidity" zone. The
tolerance band auto-scales to timeframe (wider on higher timeframes where
each bar covers more range, narrower on intraday).
Composite probability score
Every active zone receives a raw score combining four weighted components:
- Strength: volume at the pivot bar normalized against a 50-bar volume SMA,
multiplied by a clustering bonus if the zone was formed by merged pivots.
- Proximity: an inverted-U curve over the logarithmic distance to price,
peaking around 2% from current price and decaying symmetrically in both
directions.
- Age: a maturity curve. Very fresh zones are discounted (the market has
not had time to confirm them), mature zones get full weight, and very
old zones decay gradually.
- Momentum: a directional alignment factor. If short-term EMA momentum
points toward a zone, that zone's score is boosted; if momentum points
away, the score is reduced.
All zone scores are then divided by their sum to produce a probability
percentage. The highest-percentage zone is the top magnet.
Magnet Pull direction
The dashboard's Magnet Pull metric reports the direction toward the top
magnet (bullish if the top zone is above price, bearish if below), weighted
by the share of total score on that side. This is a direction indicator,
not a momentum signal.
Pruning
Zones are removed when one of three things happens: price reaches the zone
(swept), the zone exceeds the maximum age in bars, or the zone moves outside
the log-distance filter as price evolves.
HOW TO USE IT
The intended workflow is contextual, not signal-based:
1. Open the chart on your trading timeframe. Auto-scale picks reasonable
defaults for clustering tolerance and distance filter; both can be
overridden manually.
2. Read the dashboard. The top target price and probability give you the
single most likely magnet. The Magnet Pull and Pull Intensity describe
directional bias. The proximity progress bar shows how close price
currently is to the top magnet in log space.
3. Use Top 3 targets for alternatives. The probability gap between rank 1
and ranks 2-3 tells you how dominant the top magnet is. A 40% / 38% /
22% spread is much less decisive than a 60% / 25% / 15% spread.
4. Enable Historical Track to evaluate behavior. Past top magnets are
marked with their outcome on the chart. The rolling Historical Touch %
in the dashboard summarizes the script's recent behavior on the current
instrument and timeframe. This is observational data, not a guarantee.
5. Treat outputs as context, not signals. The script highlights where
liquidity is concentrated and which target the composite model considers
most probable. Trade entries, stop placement, and position sizing remain
the user's responsibility.
PARAMETERS
Pivot Lookback — bars on each side used to confirm a swing point. Higher
values produce fewer but more significant zones.
Equal H/L Tolerance % — clustering threshold. Pivots within this percentage
in the same direction merge into a single zone. Auto-scaled by default.
Log-Distance — maximum allowed distance in log space between price and any
active zone. Auto-scaled by default. Symmetric: covers both above and below
price.
Weight inputs (Strength, Proximity, Age, Momentum) — relative influence of
each scoring component. Default values are calibrated for crypto and equity
intraday/swing usage. Adjusting weights changes the character of the ranking.
Tracking Window (bars) — how long a former top magnet stays "pending" before
being marked as expired.
UI Sizing controls — dashboard position, dashboard text size, zone label
sizes, magnet marker size, historical marker size, all independently
adjustable for personal screen and screenshot preferences.
QUICK START
1. Add the script to any chart
2. Auto-scale handles parameters automatically
3. Look at "Top Target" in the dashboard — that's the most likely magnet
4. Look at "Magnet Pull" — that's the directional bias
5. Turn on "Show Historical Top Magnets" to see past behavior
No setup required. All defaults are calibrated.
TESTED ACROSS
Verified visually on multiple instruments and timeframes:
- Cryptocurrency: BTCUSD, ETHUSD, SOLUSD on 1H to 1W
- Equity indices: NQ, ES on 4H to 1D
- Forex majors: EURUSD, GBPUSD on 1H to 1D
- Commodities: Gold (XAUUSD), Crude Oil on 1D
Auto-scale parameters cover all these instruments and timeframes without
manual tuning. Manual override is available for specific instrument behavior.
NOTES AND LIMITATIONS
- The script is non-repainting on confirmed bars. Pivot detection uses a
fixed forward lookback, which means zones appear after the pivot is
confirmed (lookback bars after the high/low), not in real-time at the
exact bar of the high/low. This is intentional.
- Probability percentages are relative weights inside the active zone set,
not absolute statistical probabilities. They describe the composite
model's ranking, not a calibrated forecast.
- The Historical Touch % is a descriptive statistic over a rolling window.
It reflects observed behavior and does not project future performance.
- Bar Replay is supported: scoring updates on every confirmed bar and
historical markers are placed at the recorded positions, so the chart
behaves consistently when scrubbing through history.
- The script does not generate buy/sell signals. There is no entry/exit
logic, no stop/target output, and no strategy() conversion. It is a
visual analysis tool.
This script is original work. The composite scoring formula, the log-distance
filtering approach, the pool merging algorithm, the directional Magnet Pull
metric, and the historical tracking logic are all custom implementations
written specifically for this script.
オープンソーススクリプト
TradingViewの精神に則り、このスクリプトの作者はコードをオープンソースとして公開してくれました。トレーダーが内容を確認・検証できるようにという配慮です。作者に拍手を送りましょう!無料で利用できますが、コードの再公開はハウスルールに従う必要があります。

💰Free Channel — t.me/FeelsStrategy
🤵For more info contact — t.me/VolodymyrFeels
🔗 Links — feelsstrategy.com/links
🤵For more info contact — t.me/VolodymyrFeels
🔗 Links — feelsstrategy.com/links
免責事項
これらの情報および投稿は、TradingViewが提供または承認する金融、投資、取引、またはその他の種類の助言もしくは推奨であることを意図したものではなく、またこれらに該当するものでもありません。詳細は利用規約をご覧ください。
オープンソーススクリプト
TradingViewの精神に則り、このスクリプトの作者はコードをオープンソースとして公開してくれました。トレーダーが内容を確認・検証できるようにという配慮です。作者に拍手を送りましょう!無料で利用できますが、コードの再公開はハウスルールに従う必要があります。
💰Free Channel — t.me/FeelsStrategy
🤵For more info contact — t.me/VolodymyrFeels
🔗 Links — feelsstrategy.com/links
🤵For more info contact — t.me/VolodymyrFeels
🔗 Links — feelsstrategy.com/links
免責事項
これらの情報および投稿は、TradingViewが提供または承認する金融、投資、取引、またはその他の種類の助言もしくは推奨であることを意図したものではなく、またこれらに該当するものでもありません。詳細は利用規約をご覧ください。