OPEN-SOURCE SCRIPT
更新済 RSI Candlestick Chart
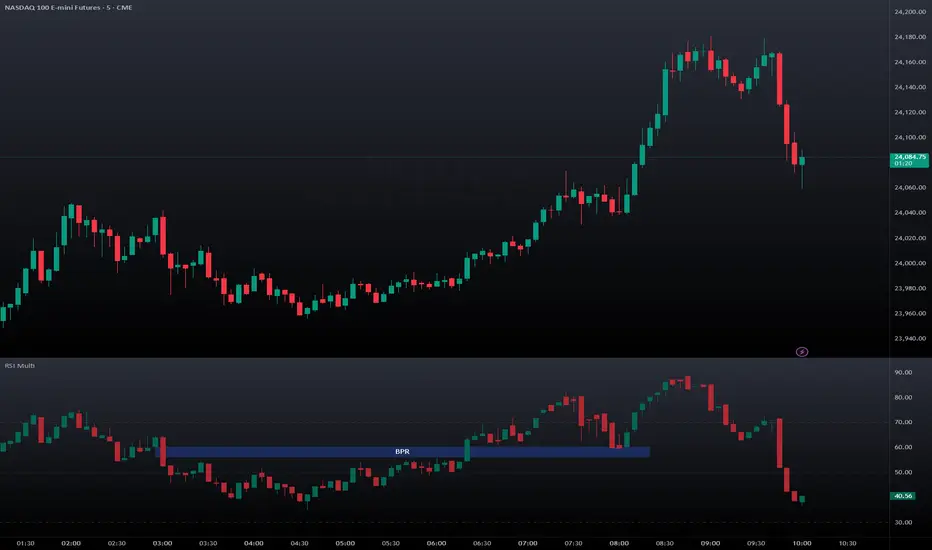
A simple and clean yet powerful RSI in candlestick version.
The concept is simple: just like a line chart hides from you a lot of information that candlestick chart can reveal, why not doing the same with RSI?
Now you can clearly see the wicks, patterns, structure at a single glance.
FVG, BPR, hammer, you name it.
The concept is simple: just like a line chart hides from you a lot of information that candlestick chart can reveal, why not doing the same with RSI?
Now you can clearly see the wicks, patterns, structure at a single glance.
FVG, BPR, hammer, you name it.
リリースノート
The new updated version adds the possibility to switch to Heiken Ashi or back to line chart if needed. Also updated it to V6 while at it. リリースノート
small update to restore the proper chart styleオープンソーススクリプト
TradingViewの精神に則り、このスクリプトの作者はコードをオープンソースとして公開してくれました。トレーダーが内容を確認・検証できるようにという配慮です。作者に拍手を送りましょう!無料で利用できますが、コードの再公開はハウスルールに従う必要があります。

免責事項
これらの情報および投稿は、TradingViewが提供または承認する金融、投資、取引、またはその他の種類の助言もしくは推奨であることを意図したものではなく、またこれらに該当するものでもありません。詳細は利用規約をご覧ください。
オープンソーススクリプト
TradingViewの精神に則り、このスクリプトの作者はコードをオープンソースとして公開してくれました。トレーダーが内容を確認・検証できるようにという配慮です。作者に拍手を送りましょう!無料で利用できますが、コードの再公開はハウスルールに従う必要があります。
免責事項
これらの情報および投稿は、TradingViewが提供または承認する金融、投資、取引、またはその他の種類の助言もしくは推奨であることを意図したものではなく、またこれらに該当するものでもありません。詳細は利用規約をご覧ください。