OPEN-SOURCE SCRIPT
Sonic R (13-34-89) by DQT
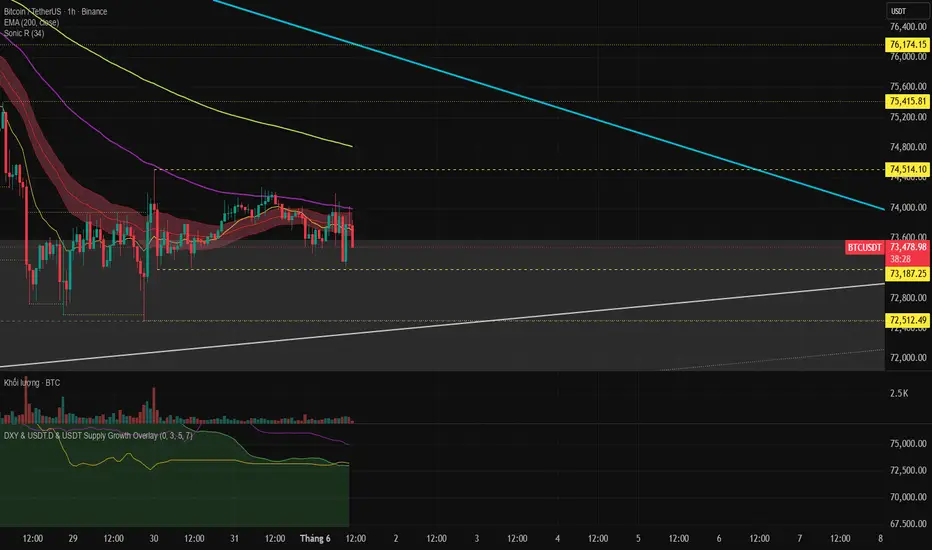
Sonic R System - EMA 13-34-89-200
Description:
The Sonic R indicator is built upon a multi-layered Exponential Moving Average (EMA) system combined with a Price Action Channel (PAC), designed to identify market trends, dynamic support/resistance zones, and high-probability trade entries.
Core Components:
1. Price Action Channel (PAC) — EMA 34 Band
The PAC is calculated using EMA 34 applied to High, Low, and Close prices, forming a dynamic channel that represents the short-term equilibrium zone. Price above the channel signals bullish momentum; price below signals bearish pressure.
2. EMA Trend System:
🟡 EMA 13 — Fast-reacting short-term trend, captures immediate price momentum
🔴 EMA 34 — Core support/resistance zone displayed as a red band, acts as the market's heartbeat
🟣 EMA 89 — Medium-term trend filter, smooths out market noise
🟢 EMA 200 — Long-term trend anchor, defines the overall market direction
How to Use:
Price above all EMAs → strong uptrend, prioritize buy setups
Price below all EMAs → strong downtrend, prioritize sell setups
Price inside the red EMA 34 band → market consolidating, wait for breakout confirmation
EMAs stacked in order (13 > 34 > 89 > 200) → trend is clean and strong, highest confidence entries
Best Used On: All timeframes — most effective on H1, H4, and Daily charts.
Description:
The Sonic R indicator is built upon a multi-layered Exponential Moving Average (EMA) system combined with a Price Action Channel (PAC), designed to identify market trends, dynamic support/resistance zones, and high-probability trade entries.
Core Components:
1. Price Action Channel (PAC) — EMA 34 Band
The PAC is calculated using EMA 34 applied to High, Low, and Close prices, forming a dynamic channel that represents the short-term equilibrium zone. Price above the channel signals bullish momentum; price below signals bearish pressure.
2. EMA Trend System:
🟡 EMA 13 — Fast-reacting short-term trend, captures immediate price momentum
🔴 EMA 34 — Core support/resistance zone displayed as a red band, acts as the market's heartbeat
🟣 EMA 89 — Medium-term trend filter, smooths out market noise
🟢 EMA 200 — Long-term trend anchor, defines the overall market direction
How to Use:
Price above all EMAs → strong uptrend, prioritize buy setups
Price below all EMAs → strong downtrend, prioritize sell setups
Price inside the red EMA 34 band → market consolidating, wait for breakout confirmation
EMAs stacked in order (13 > 34 > 89 > 200) → trend is clean and strong, highest confidence entries
Best Used On: All timeframes — most effective on H1, H4, and Daily charts.
オープンソーススクリプト
TradingViewの精神に則り、このスクリプトの作者はコードをオープンソースとして公開してくれました。トレーダーが内容を確認・検証できるようにという配慮です。作者に拍手を送りましょう!無料で利用できますが、コードの再公開はハウスルールに従う必要があります。

免責事項
これらの情報および投稿は、TradingViewが提供または承認する金融、投資、取引、またはその他の種類の助言もしくは推奨であることを意図したものではなく、またこれらに該当するものでもありません。詳細は利用規約をご覧ください。
オープンソーススクリプト
TradingViewの精神に則り、このスクリプトの作者はコードをオープンソースとして公開してくれました。トレーダーが内容を確認・検証できるようにという配慮です。作者に拍手を送りましょう!無料で利用できますが、コードの再公開はハウスルールに従う必要があります。
免責事項
これらの情報および投稿は、TradingViewが提供または承認する金融、投資、取引、またはその他の種類の助言もしくは推奨であることを意図したものではなく、またこれらに該当するものでもありません。詳細は利用規約をご覧ください。