OPEN-SOURCE SCRIPT
Elaris 1D High-Low Boxes Pro
# Elaris 1D High-Low Boxes Pro
This indicator was built around a simple idea:
Higher timeframe ranges often control intraday price behavior more than most traders realize.
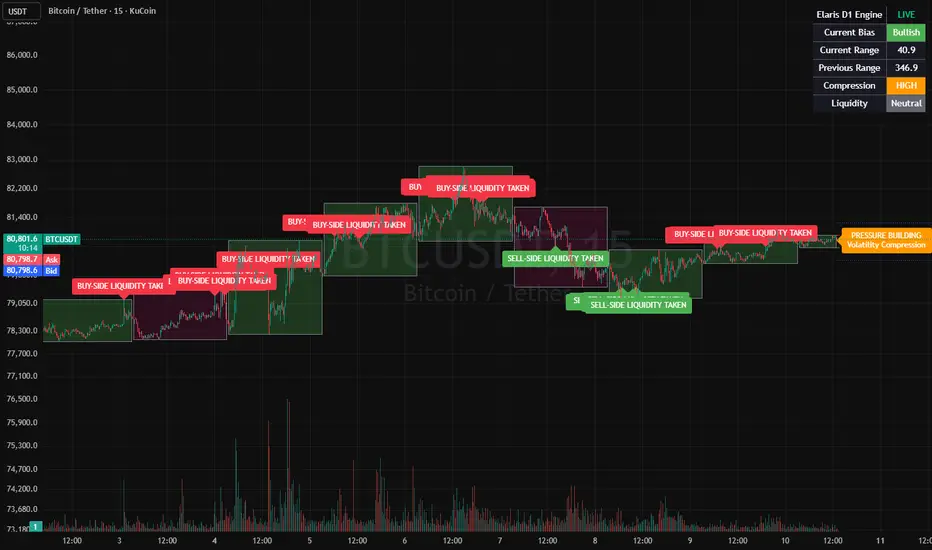
The script maps Daily range activity directly onto lower timeframes and focuses on how price reacts around previous highs, lows, compression zones, and liquidity areas during the session.
Instead of plotting static support/resistance levels, the indicator continuously tracks the active Daily range and updates its structure in real time as the session develops.
Main features included in the script:
• Dynamic Daily high-low boxes
• Previous Daily high/low projections
• Liquidity sweep detection
• Volatility compression detection
• Expansion projection levels
• Market condition dashboard
• Bullish/Bearish range visualization
The liquidity sweep logic is designed to highlight situations where price trades above or below a previous Daily level and quickly reclaims the range. These areas can sometimes provide useful context for reversals, failed breakouts, or continuation setups.
The compression engine monitors decreasing Daily ranges and attempts to identify periods where volatility is contracting before expansion. When compression conditions appear, the script labels the chart to indicate potential pressure buildup.
Projected expansion zones are calculated using previous Daily range behavior and can be used as reference areas during breakout conditions.
Recommended usage:
* Intraday trading
* Scalping
* Session trading
* Market structure analysis
* Liquidity-based trading models
Recommended chart timeframes:
* 5m
* 15m
* 30m
* 1H
The script is intended as a market context and visualization tool rather than a standalone trading system.
Built by ElarisGroup.
This indicator was built around a simple idea:
Higher timeframe ranges often control intraday price behavior more than most traders realize.
The script maps Daily range activity directly onto lower timeframes and focuses on how price reacts around previous highs, lows, compression zones, and liquidity areas during the session.
Instead of plotting static support/resistance levels, the indicator continuously tracks the active Daily range and updates its structure in real time as the session develops.
Main features included in the script:
• Dynamic Daily high-low boxes
• Previous Daily high/low projections
• Liquidity sweep detection
• Volatility compression detection
• Expansion projection levels
• Market condition dashboard
• Bullish/Bearish range visualization
The liquidity sweep logic is designed to highlight situations where price trades above or below a previous Daily level and quickly reclaims the range. These areas can sometimes provide useful context for reversals, failed breakouts, or continuation setups.
The compression engine monitors decreasing Daily ranges and attempts to identify periods where volatility is contracting before expansion. When compression conditions appear, the script labels the chart to indicate potential pressure buildup.
Projected expansion zones are calculated using previous Daily range behavior and can be used as reference areas during breakout conditions.
Recommended usage:
* Intraday trading
* Scalping
* Session trading
* Market structure analysis
* Liquidity-based trading models
Recommended chart timeframes:
* 5m
* 15m
* 30m
* 1H
The script is intended as a market context and visualization tool rather than a standalone trading system.
Built by ElarisGroup.
オープンソーススクリプト
TradingViewの精神に則り、このスクリプトの作者はコードをオープンソースとして公開してくれました。トレーダーが内容を確認・検証できるようにという配慮です。作者に拍手を送りましょう!無料で利用できますが、コードの再公開はハウスルールに従う必要があります。

免責事項
これらの情報および投稿は、TradingViewが提供または承認する金融、投資、取引、またはその他の種類の助言もしくは推奨であることを意図したものではなく、またこれらに該当するものでもありません。詳細は利用規約をご覧ください。
オープンソーススクリプト
TradingViewの精神に則り、このスクリプトの作者はコードをオープンソースとして公開してくれました。トレーダーが内容を確認・検証できるようにという配慮です。作者に拍手を送りましょう!無料で利用できますが、コードの再公開はハウスルールに従う必要があります。
免責事項
これらの情報および投稿は、TradingViewが提供または承認する金融、投資、取引、またはその他の種類の助言もしくは推奨であることを意図したものではなく、またこれらに該当するものでもありません。詳細は利用規約をご覧ください。