OPEN-SOURCE SCRIPT
Volume Profile With Smart Level Detection
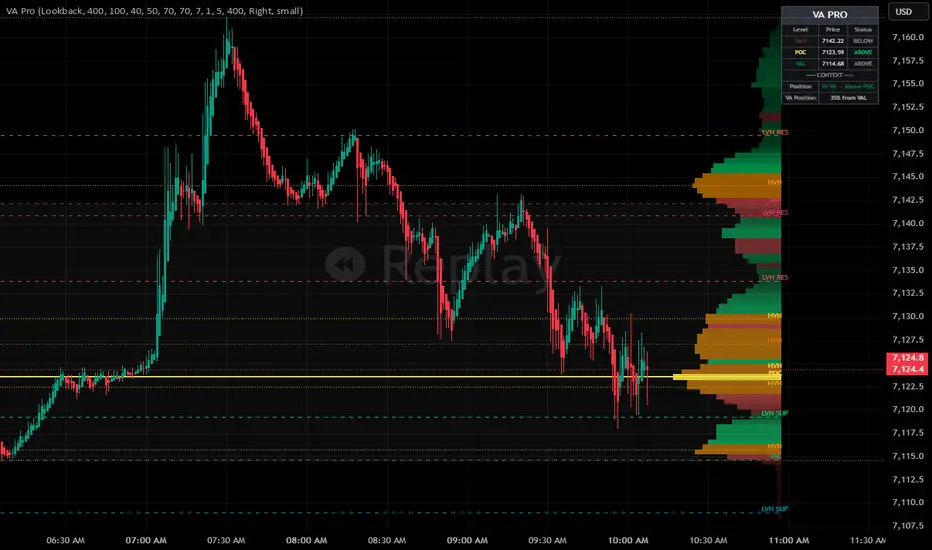
Value Area Pro — Volume Profile with Smart Level Detection
This indicator builds a full Volume Profile directly on your chart and automatically identifies the key levels that institutions and smart money use to make decisions.
What it shows:
Volume Profile — a horizontal bar chart built from real traded volume at each price level. Green bars where buyers dominated, red bars where sellers dominated, yellow bar at the Point of Control — the single price with the most volume traded during the session.
POC (Point of Control) — the brightest yellow line extending across the chart. This is the price magnet. The market gravitates back to this level throughout the session because it represents the fairest price agreed upon by both buyers and sellers.
VAH / VAL (Value Area High and Low) — the two dashed lines forming the boundary of the Value Area. 70% of all volume was traded between these two lines. Everything inside is considered fair value. Everything outside is considered extreme.
HVN (High Volume Node) — dotted lines marking zones where a large amount of volume concentrated. Price tends to slow down, rotate, and build structure at these levels. These are walls — price gets stuck here.
LVN (Low Volume Node) — dashed lines marking zones where volume was thin and price moved through quickly. These are fast lanes — price accelerates through them with little resistance. When price approaches an LVN it tends to either reject sharply or blow straight through.
How to use it:
The core idea is simple — 70% of all trades happen inside the Value Area. The market is balanced and boring inside this zone. The edges are where the opportunities are.
At the VAL — price is at a statistical discount. Smart money tends to buy here in a balanced market.
At the VAH — price is at a statistical premium. Smart money tends to sell here in a balanced market.
At an LVN — price is in a fast lane. Expect acceleration, not consolidation. Use these as targets when price is trending, and as warning zones when price is ranging.
At an HVN — price is in a wall. Expect slowdown, consolidation, and possible reversal. These are the strongest support and resistance levels because real volume was traded there.
Settings:
Mode — Session resets the profile each trading day. Lookback uses a fixed number of bars
Value Area % — standard is 70. Raise to 80 for a wider zone, lower to 60 for a tighter one
HVN Threshold % — bins above this percentage of max volume are marked as High Volume Nodes
Max LVN Lines — maximum number of Low Volume Node lines shown, always the closest to current price
Label Position — move labels Left, Center, or Right along the line
Show Background — optional subtle color when price is outside the Value Area
This indicator builds a full Volume Profile directly on your chart and automatically identifies the key levels that institutions and smart money use to make decisions.
What it shows:
Volume Profile — a horizontal bar chart built from real traded volume at each price level. Green bars where buyers dominated, red bars where sellers dominated, yellow bar at the Point of Control — the single price with the most volume traded during the session.
POC (Point of Control) — the brightest yellow line extending across the chart. This is the price magnet. The market gravitates back to this level throughout the session because it represents the fairest price agreed upon by both buyers and sellers.
VAH / VAL (Value Area High and Low) — the two dashed lines forming the boundary of the Value Area. 70% of all volume was traded between these two lines. Everything inside is considered fair value. Everything outside is considered extreme.
HVN (High Volume Node) — dotted lines marking zones where a large amount of volume concentrated. Price tends to slow down, rotate, and build structure at these levels. These are walls — price gets stuck here.
LVN (Low Volume Node) — dashed lines marking zones where volume was thin and price moved through quickly. These are fast lanes — price accelerates through them with little resistance. When price approaches an LVN it tends to either reject sharply or blow straight through.
How to use it:
The core idea is simple — 70% of all trades happen inside the Value Area. The market is balanced and boring inside this zone. The edges are where the opportunities are.
At the VAL — price is at a statistical discount. Smart money tends to buy here in a balanced market.
At the VAH — price is at a statistical premium. Smart money tends to sell here in a balanced market.
At an LVN — price is in a fast lane. Expect acceleration, not consolidation. Use these as targets when price is trending, and as warning zones when price is ranging.
At an HVN — price is in a wall. Expect slowdown, consolidation, and possible reversal. These are the strongest support and resistance levels because real volume was traded there.
Settings:
Mode — Session resets the profile each trading day. Lookback uses a fixed number of bars
Value Area % — standard is 70. Raise to 80 for a wider zone, lower to 60 for a tighter one
HVN Threshold % — bins above this percentage of max volume are marked as High Volume Nodes
Max LVN Lines — maximum number of Low Volume Node lines shown, always the closest to current price
Label Position — move labels Left, Center, or Right along the line
Show Background — optional subtle color when price is outside the Value Area
オープンソーススクリプト
TradingViewの精神に則り、このスクリプトの作者はコードをオープンソースとして公開してくれました。トレーダーが内容を確認・検証できるようにという配慮です。作者に拍手を送りましょう!無料で利用できますが、コードの再公開はハウスルールに従う必要があります。

免責事項
これらの情報および投稿は、TradingViewが提供または承認する金融、投資、取引、またはその他の種類の助言もしくは推奨であることを意図したものではなく、またこれらに該当するものでもありません。詳細は利用規約をご覧ください。
オープンソーススクリプト
TradingViewの精神に則り、このスクリプトの作者はコードをオープンソースとして公開してくれました。トレーダーが内容を確認・検証できるようにという配慮です。作者に拍手を送りましょう!無料で利用できますが、コードの再公開はハウスルールに従う必要があります。
免責事項
これらの情報および投稿は、TradingViewが提供または承認する金融、投資、取引、またはその他の種類の助言もしくは推奨であることを意図したものではなく、またこれらに該当するものでもありません。詳細は利用規約をご覧ください。