OPEN-SOURCE SCRIPT
ElliottABC Pulse Multi-Timeframe Correction Mapper
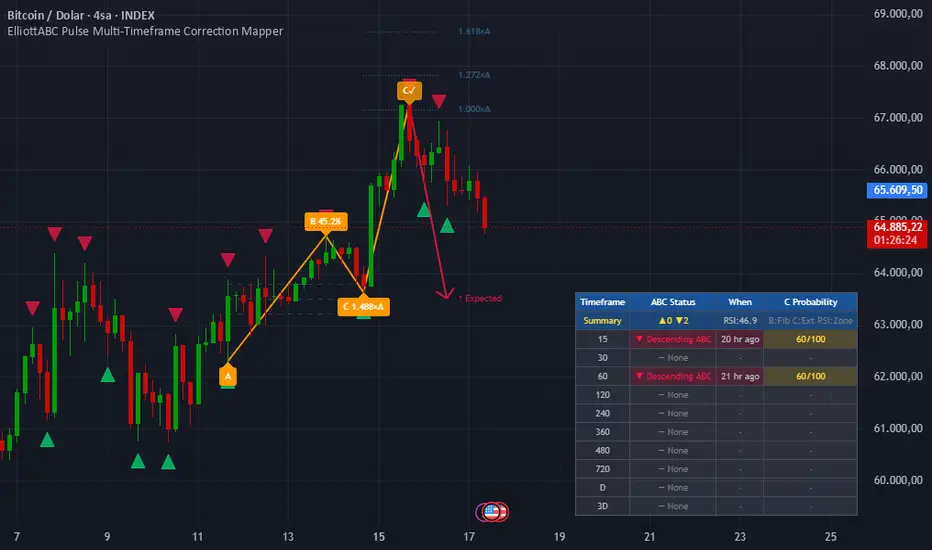
ElliottABC Pulse – Multi-Timeframe Correction Mapper
ElliottABC Pulse automatically identifies and labels Elliott Wave ABC corrective structures across up to ten simultaneous timeframes, combining classical wave theory with Fibonacci ratio validation, RSI confluence filtering, and a real-time signal scoring engine — all rendered as a single chart overlay.
Instead of manually hunting for corrective patterns on each timeframe separately, this indicator scans pivot structures across all selected timeframes at once and presents a consolidated dashboard showing signal direction, elapsed time since formation, and a composite quality score for every active timeframe.
What Is an ABC Correction?
In Elliott Wave theory, markets move in two phases: impulsive waves (in the direction of the trend) and corrective waves (counter-trend). The ABC correction is the most common corrective structure, consisting of three legs:
Wave A — The initial counter-trend move from a swing high or low
Wave B — A partial retracement back toward the origin of wave A
Wave C — A final push in the direction of wave A, typically equal to or extending beyond wave A
When the C wave completes, price often resumes the original trend direction — making C completions high-probability areas for re-entry or reversal trades.
This indicator detects two variants:
Descending ABC (H-L-H-L): A bearish correction that resolves into a potential bullish continuation. The C wave terminates below the B wave origin.
Ascending ABC (L-H-L-H): A bullish correction that resolves into a potential bearish continuation. The C wave terminates above the B wave origin.
Features
Automatic ABC corrective pattern detection using zigzag pivot filtering
Strict Fibonacci ratio validation for both wave B retracement and wave C extension
Optional RSI momentum confluence filter
Real-time 0–100 composite signal scoring system
Fibonacci target projection levels (1.000×A, 1.272×A, 1.618×A)
B wave retracement grid (38.2%, 50.0%, 61.8%)
Expected direction arrow projected from the C completion point
Duplicate-safe drawing engine — the same pattern is never drawn twice
Multi-timeframe dashboard across up to 10 user-defined timeframes
Color-coded elapsed time indicator (fresh / aging / stale signals)
Clean, non-repainting overlay with full input customization
How It Works
Pivot Detection
The indicator uses Pine Script's ta.pivothigh() and ta.pivotlow() functions with user-defined left and right bar counts to identify structural swing highs and lows. A zigzag filter (Min. Swing Size %) discards any pivot where the price move is smaller than the defined percentage threshold, eliminating micro-noise from the pivot array and keeping only meaningful structural swings.
Pivots are stored in an alternating high/low array. If two consecutive pivots occur in the same direction, only the more extreme one is kept — ensuring the zigzag structure is always clean and directionally alternating.
ABC Validation
Each candidate pattern is tested against five conditions simultaneously:
ConditionRequirementAlternating structurePivots must follow strict H-L-H-L or L-H-L-H alternationB retracement (min)Wave B must retrace at least Min A-B Retracement of wave A (default 38.2%)B retracement (max)Wave B must not retrace more than Max A-B Retracement of wave A (default 88.6%)C extension (min)Wave C must extend at least Min C Extension of wave A (default 1.0×)C extension (max)Wave C must not extend beyond Max C Extension of wave A (default 1.618×)Structural integrityC must break B's origin; B must not exceed A's originRSI confluence (optional)Descending ABC: RSI < 50 / Ascending ABC: RSI > 50
The indicator scans up to 6 consecutive pivot windows on each bar update, so it catches both fresh and recently formed patterns without missing setups due to pivot array timing.
Duplicate Prevention
A dedicated index array tracks the bar position of each pattern's A pivot. Once a pattern is drawn, its A bar index is recorded and skipped on all future bar updates — preventing the redraw artifacts common in pivot-based indicators.
Signal Scoring (0–100)
Every confirmed ABC pattern receives a composite score from four independent components:
ComponentMax ScoreConditionB Fibonacci Zone30 ptsB retracement within 0.500–0.618 (golden zone) scores full; 0.382–0.786 scores partialC Extension Zone25 ptsC extension within 1.0–1.272 (classic target) scores full; 1.272–1.618 scores partialRSI Extreme Zone25 ptsRSI below 30 (Bull) or above 70 (Bear) scores full; partial credit between 30–50 or 50–70A Wave Magnitude20 ptsWave A spanning ≥ 2% of price scores full; ≥ 1% scores partial
Scores of 70 or above indicate high-quality setups. Scores between 40–69 are moderate. Below 40 suggests marginal structure — still valid, but lower-conviction.
Chart Overlays
When a valid ABC is confirmed, the following elements are drawn directly on the chart:
Wave labels: A at the origin, B with its retracement percentage, C with its extension multiplier, and C✓ at the completion point
Connecting lines: Segment lines linking A → B → C → C✓
Fibonacci extension levels: Three dotted horizontal lines projected from the C pivot — 1.000×A, 1.272×A, and 1.618×A — showing classic C wave targets
B retracement grid: Three dashed horizontal levels at 38.2%, 50.0%, and 61.8% between A and B for precision B entry zones
Direction arrow: A projected arrow from the C✓ point toward the A-B midpoint, visually indicating the expected post-correction move direction
Multi-Timeframe Dashboard
The bottom-right table runs the full ABC detection engine independently on each of the 10 configured timeframes using request.security() with lookahead_off to prevent any future data leakage.
Each row in the table shows:
ColumnDescriptionTimeframeThe TF label as configured (e.g. 15, 60, 240, D)ABC Status▲ Ascending ABC / ▼ Descending ABC / — NoneWhenHow long ago the C pivot formed — color-coded green (< 30 min), yellow (< 4 hr), gray (older)C ProbabilityThe composite 0–100 score, color-coded green / yellow / red by strength tier
A summary row at the top displays the total count of bullish and bearish signals across all timeframes, plus the current RSI reading color-coded by zone. When multiple timeframes simultaneously show the same signal direction, confluence is high and setup quality increases significantly.
How To Use
Basic Setup
Add the indicator to your chart on any timeframe
Set TF 1 through TF 10 to the timeframes you want to monitor simultaneously (e.g. 15m, 30m, 1H, 2H, 4H, 6H, 8H, 12H, D, 3D)
Watch the bottom-right dashboard for active ABC signals across all timeframes
Tuning Pivot Sensitivity
Increase Left Bars / Right Bars for fewer, stronger pivots (better for higher timeframe structure)
Decrease them for more frequent, shorter-term pivots (better for intraday scalping)
Raise Min. Swing Size (%) to filter out noisy pivots on volatile assets such as crypto
Tuning ABC Strictness
Tighten Min/Max A-B Retracement to focus only on golden zone retracements (0.5–0.618)
Narrow Min/Max C Extension to require only classic C targets (1.0–1.272)
Enable RSI Divergence Filter on trending instruments for higher-conviction signals
Reading the Dashboard
Prioritize signals where 3 or more timeframes show the same direction simultaneously
Prefer signals with scores of 70 or above for the clearest Fibonacci structure
Use the When column to avoid acting on stale signals — fresh signals (green) carry more weight
Cross-reference with the current RSI reading in the summary row for momentum context
Fibonacci Levels
The 1.000×A level is the minimum expected C target — often used as a conservative take-profit
The 1.272×A level is the most common termination zone for standard ABC patterns
The 1.618×A level marks the extended C target — relevant in high-momentum corrective moves
The B retracement grid (38.2% / 50% / 61.8%) helps identify optimal B-wave entry levels before C begins
Recommended Use Cases
Intraday traders: Configure TF 1–5 as 5m / 15m / 30m / 1H / 2H. Look for ABC completions on the 15m or 30m confirmed by a matching signal on the 1H or 2H for intrabar precision entries.
Swing traders: Use 1H / 4H / 6H / 12H / Daily / 3D. Wait for the daily or 3D to print a fresh high-score ABC before entering on a lower timeframe pullback.
Multi-timeframe analysts: Monitor confluence across all 10 timeframes. When 4 or more timeframes simultaneously show the same signal type with scores above 60, the corrective structure is likely significant on the macro level.
Originality
This script is an original work combining zigzag-filtered pivot detection, simultaneous ten-timeframe ABC corrective pattern validation, a four-component signal scoring engine, and a proximity-safe duplicate prevention system. While Elliott Wave ABC detection is a known concept, the specific implementation — the alternating zigzag array, the 6-window sliding pattern scan, the composite scoring model, and the fully integrated MTF dashboard with elapsed-time coloring — represents the author's own approach to making corrective wave analysis practical and actionable on a live chart.
Limitations
RSI filtering uses the current bar RSI as an approximation for pivot-bar RSI. This is a deliberate simplification that improves signal quality on trending instruments but may occasionally exclude valid setups during consolidation.
The pivot array is capped at 50 pivots and the drawing history arrays at 100 entries to maintain performance. On very active instruments with tight pivot settings, the oldest patterns scroll off automatically.
TradingView's runtime limit of 500 labels and 500 lines applies. On charts with a very long history and tight pivot settings, older drawings are removed by the platform.
This tool is designed for confluence analysis and structural context, not as a standalone mechanical entry system. Always integrate with broader market structure, session context, and sound risk management.
Disclaimer
This indicator is intended for educational and analytical purposes only. No indicator can predict future market movements with certainty. Always use proper risk management and combine multiple forms of analysis before making trading decisions.
TradingView Short Description:
Automatically detect Elliott Wave ABC corrective completions across up to 10 timeframes. Features Fibonacci ratio validation, RSI confluence filtering, a 0–100 signal scoring engine, and a live multi-timeframe dashboard showing signal direction, elapsed time, and setup quality — all in a single chart overlay.
ElliottABC Pulse automatically identifies and labels Elliott Wave ABC corrective structures across up to ten simultaneous timeframes, combining classical wave theory with Fibonacci ratio validation, RSI confluence filtering, and a real-time signal scoring engine — all rendered as a single chart overlay.
Instead of manually hunting for corrective patterns on each timeframe separately, this indicator scans pivot structures across all selected timeframes at once and presents a consolidated dashboard showing signal direction, elapsed time since formation, and a composite quality score for every active timeframe.
What Is an ABC Correction?
In Elliott Wave theory, markets move in two phases: impulsive waves (in the direction of the trend) and corrective waves (counter-trend). The ABC correction is the most common corrective structure, consisting of three legs:
Wave A — The initial counter-trend move from a swing high or low
Wave B — A partial retracement back toward the origin of wave A
Wave C — A final push in the direction of wave A, typically equal to or extending beyond wave A
When the C wave completes, price often resumes the original trend direction — making C completions high-probability areas for re-entry or reversal trades.
This indicator detects two variants:
Descending ABC (H-L-H-L): A bearish correction that resolves into a potential bullish continuation. The C wave terminates below the B wave origin.
Ascending ABC (L-H-L-H): A bullish correction that resolves into a potential bearish continuation. The C wave terminates above the B wave origin.
Features
Automatic ABC corrective pattern detection using zigzag pivot filtering
Strict Fibonacci ratio validation for both wave B retracement and wave C extension
Optional RSI momentum confluence filter
Real-time 0–100 composite signal scoring system
Fibonacci target projection levels (1.000×A, 1.272×A, 1.618×A)
B wave retracement grid (38.2%, 50.0%, 61.8%)
Expected direction arrow projected from the C completion point
Duplicate-safe drawing engine — the same pattern is never drawn twice
Multi-timeframe dashboard across up to 10 user-defined timeframes
Color-coded elapsed time indicator (fresh / aging / stale signals)
Clean, non-repainting overlay with full input customization
How It Works
Pivot Detection
The indicator uses Pine Script's ta.pivothigh() and ta.pivotlow() functions with user-defined left and right bar counts to identify structural swing highs and lows. A zigzag filter (Min. Swing Size %) discards any pivot where the price move is smaller than the defined percentage threshold, eliminating micro-noise from the pivot array and keeping only meaningful structural swings.
Pivots are stored in an alternating high/low array. If two consecutive pivots occur in the same direction, only the more extreme one is kept — ensuring the zigzag structure is always clean and directionally alternating.
ABC Validation
Each candidate pattern is tested against five conditions simultaneously:
ConditionRequirementAlternating structurePivots must follow strict H-L-H-L or L-H-L-H alternationB retracement (min)Wave B must retrace at least Min A-B Retracement of wave A (default 38.2%)B retracement (max)Wave B must not retrace more than Max A-B Retracement of wave A (default 88.6%)C extension (min)Wave C must extend at least Min C Extension of wave A (default 1.0×)C extension (max)Wave C must not extend beyond Max C Extension of wave A (default 1.618×)Structural integrityC must break B's origin; B must not exceed A's originRSI confluence (optional)Descending ABC: RSI < 50 / Ascending ABC: RSI > 50
The indicator scans up to 6 consecutive pivot windows on each bar update, so it catches both fresh and recently formed patterns without missing setups due to pivot array timing.
Duplicate Prevention
A dedicated index array tracks the bar position of each pattern's A pivot. Once a pattern is drawn, its A bar index is recorded and skipped on all future bar updates — preventing the redraw artifacts common in pivot-based indicators.
Signal Scoring (0–100)
Every confirmed ABC pattern receives a composite score from four independent components:
ComponentMax ScoreConditionB Fibonacci Zone30 ptsB retracement within 0.500–0.618 (golden zone) scores full; 0.382–0.786 scores partialC Extension Zone25 ptsC extension within 1.0–1.272 (classic target) scores full; 1.272–1.618 scores partialRSI Extreme Zone25 ptsRSI below 30 (Bull) or above 70 (Bear) scores full; partial credit between 30–50 or 50–70A Wave Magnitude20 ptsWave A spanning ≥ 2% of price scores full; ≥ 1% scores partial
Scores of 70 or above indicate high-quality setups. Scores between 40–69 are moderate. Below 40 suggests marginal structure — still valid, but lower-conviction.
Chart Overlays
When a valid ABC is confirmed, the following elements are drawn directly on the chart:
Wave labels: A at the origin, B with its retracement percentage, C with its extension multiplier, and C✓ at the completion point
Connecting lines: Segment lines linking A → B → C → C✓
Fibonacci extension levels: Three dotted horizontal lines projected from the C pivot — 1.000×A, 1.272×A, and 1.618×A — showing classic C wave targets
B retracement grid: Three dashed horizontal levels at 38.2%, 50.0%, and 61.8% between A and B for precision B entry zones
Direction arrow: A projected arrow from the C✓ point toward the A-B midpoint, visually indicating the expected post-correction move direction
Multi-Timeframe Dashboard
The bottom-right table runs the full ABC detection engine independently on each of the 10 configured timeframes using request.security() with lookahead_off to prevent any future data leakage.
Each row in the table shows:
ColumnDescriptionTimeframeThe TF label as configured (e.g. 15, 60, 240, D)ABC Status▲ Ascending ABC / ▼ Descending ABC / — NoneWhenHow long ago the C pivot formed — color-coded green (< 30 min), yellow (< 4 hr), gray (older)C ProbabilityThe composite 0–100 score, color-coded green / yellow / red by strength tier
A summary row at the top displays the total count of bullish and bearish signals across all timeframes, plus the current RSI reading color-coded by zone. When multiple timeframes simultaneously show the same signal direction, confluence is high and setup quality increases significantly.
How To Use
Basic Setup
Add the indicator to your chart on any timeframe
Set TF 1 through TF 10 to the timeframes you want to monitor simultaneously (e.g. 15m, 30m, 1H, 2H, 4H, 6H, 8H, 12H, D, 3D)
Watch the bottom-right dashboard for active ABC signals across all timeframes
Tuning Pivot Sensitivity
Increase Left Bars / Right Bars for fewer, stronger pivots (better for higher timeframe structure)
Decrease them for more frequent, shorter-term pivots (better for intraday scalping)
Raise Min. Swing Size (%) to filter out noisy pivots on volatile assets such as crypto
Tuning ABC Strictness
Tighten Min/Max A-B Retracement to focus only on golden zone retracements (0.5–0.618)
Narrow Min/Max C Extension to require only classic C targets (1.0–1.272)
Enable RSI Divergence Filter on trending instruments for higher-conviction signals
Reading the Dashboard
Prioritize signals where 3 or more timeframes show the same direction simultaneously
Prefer signals with scores of 70 or above for the clearest Fibonacci structure
Use the When column to avoid acting on stale signals — fresh signals (green) carry more weight
Cross-reference with the current RSI reading in the summary row for momentum context
Fibonacci Levels
The 1.000×A level is the minimum expected C target — often used as a conservative take-profit
The 1.272×A level is the most common termination zone for standard ABC patterns
The 1.618×A level marks the extended C target — relevant in high-momentum corrective moves
The B retracement grid (38.2% / 50% / 61.8%) helps identify optimal B-wave entry levels before C begins
Recommended Use Cases
Intraday traders: Configure TF 1–5 as 5m / 15m / 30m / 1H / 2H. Look for ABC completions on the 15m or 30m confirmed by a matching signal on the 1H or 2H for intrabar precision entries.
Swing traders: Use 1H / 4H / 6H / 12H / Daily / 3D. Wait for the daily or 3D to print a fresh high-score ABC before entering on a lower timeframe pullback.
Multi-timeframe analysts: Monitor confluence across all 10 timeframes. When 4 or more timeframes simultaneously show the same signal type with scores above 60, the corrective structure is likely significant on the macro level.
Originality
This script is an original work combining zigzag-filtered pivot detection, simultaneous ten-timeframe ABC corrective pattern validation, a four-component signal scoring engine, and a proximity-safe duplicate prevention system. While Elliott Wave ABC detection is a known concept, the specific implementation — the alternating zigzag array, the 6-window sliding pattern scan, the composite scoring model, and the fully integrated MTF dashboard with elapsed-time coloring — represents the author's own approach to making corrective wave analysis practical and actionable on a live chart.
Limitations
RSI filtering uses the current bar RSI as an approximation for pivot-bar RSI. This is a deliberate simplification that improves signal quality on trending instruments but may occasionally exclude valid setups during consolidation.
The pivot array is capped at 50 pivots and the drawing history arrays at 100 entries to maintain performance. On very active instruments with tight pivot settings, the oldest patterns scroll off automatically.
TradingView's runtime limit of 500 labels and 500 lines applies. On charts with a very long history and tight pivot settings, older drawings are removed by the platform.
This tool is designed for confluence analysis and structural context, not as a standalone mechanical entry system. Always integrate with broader market structure, session context, and sound risk management.
Disclaimer
This indicator is intended for educational and analytical purposes only. No indicator can predict future market movements with certainty. Always use proper risk management and combine multiple forms of analysis before making trading decisions.
TradingView Short Description:
Automatically detect Elliott Wave ABC corrective completions across up to 10 timeframes. Features Fibonacci ratio validation, RSI confluence filtering, a 0–100 signal scoring engine, and a live multi-timeframe dashboard showing signal direction, elapsed time, and setup quality — all in a single chart overlay.
オープンソーススクリプト
TradingViewの精神に則り、このスクリプトの作者はコードをオープンソースとして公開してくれました。トレーダーが内容を確認・検証できるようにという配慮です。作者に拍手を送りましょう!無料で利用できますが、コードの再公開はハウスルールに従う必要があります。

免責事項
これらの情報および投稿は、TradingViewが提供または承認する金融、投資、取引、またはその他の種類の助言もしくは推奨であることを意図したものではなく、またこれらに該当するものでもありません。詳細は利用規約をご覧ください。
オープンソーススクリプト
TradingViewの精神に則り、このスクリプトの作者はコードをオープンソースとして公開してくれました。トレーダーが内容を確認・検証できるようにという配慮です。作者に拍手を送りましょう!無料で利用できますが、コードの再公開はハウスルールに従う必要があります。
免責事項
これらの情報および投稿は、TradingViewが提供または承認する金融、投資、取引、またはその他の種類の助言もしくは推奨であることを意図したものではなく、またこれらに該当するものでもありません。詳細は利用規約をご覧ください。