MSnR Key Level [6 Types]
MSnR Key Level [6 Types]
This script maps support and resistance the way market structure actually builds it: from the
close of one candle handing over to the next.
Every pair of consecutive candles leaves a level behind. Depending on the two candle colours
that level is an A Level, a V Level, a Bullish Gap or a Bearish Gap. From there the script
keeps watching. The moment price closes through a level, that level does not disappear, it
FLIPS: support that breaks downward becomes resistance (SBR), resistance that breaks upward
becomes support (RBS).
The result is a complete structural map of the scan window rather than a hand-picked list of
levels, with each of the six types drawn so it can be told apart at a glance.
WHAT MAKES THIS DIFFERENT
1. Complete coverage, not a filtered selection.
Most support and resistance tools try to guess which swing points matter and throw the rest
away. This one does the opposite: every candle pair inside the scan window produces a level,
and all of them are drawn. What separates the important levels from the ordinary ones is not
whether they are shown, but how they are drawn. A level that has already been broken and
flipped looks different from one that has never been touched.
2. Levels keep flipping, and the chart shows the CURRENT state.
A level is not classified once and left alone. It is re-checked against every candle that came
after it, and every close through it flips it again. A level that broke upward, then back down,
then upward again is reported as RBS, because that is what it is today. A tool that stops at
the first break would still be calling it by its original name.
3. Six types, six line signatures.
Line weight carries strength and line colour carries side, so a line still tells you what it is
even where labels crowd together.
4. The level price is the CLOSE, not the wick.
Every level sits at the close of the first candle in the pair. Closes are where the market
actually agreed on a price, which is why a close through a level counts as a break here while a
wick through it does not.
THE SIX LEVELS
A candle is Green when close is greater than open and Red when close is less than open. A Doji,
where close equals open, is neither and forms no level. Only fully closed candles are read; the
running candle is never used.
Created from a two candle pair, the level price being the close of the FIRST candle:
A Level
Green candle followed by a Red candle. Sits above as resistance.
V Level
Red candle followed by a Green candle. Sits below as support.
Bullish Gap
Green candle followed by another Green candle. Sits below as support.
Bearish Gap
Red candle followed by another Red candle. Sits above as resistance.
Created when an existing level is broken:
RBS - Resistance Become Support
An A Level or a Bearish Gap that a Green candle later CLOSED above. The old ceiling is now a
floor.
SBR - Support Become Resistance
A V Level or a Bullish Gap that a Red candle later CLOSED below. The old floor is now a ceiling.
HOW A LEVEL FLIPS
Think of every level as living on one of two sides.
Resistance side: A Level, Bearish Gap, SBR. Price has to CLOSE above it to break it, and doing
so turns it into RBS, which moves it to the support side.
Support side: V Level, Bullish Gap, RBS. Price has to CLOSE below it to break it, and doing so
turns it into SBR, which moves it to the resistance side.
Because SBR and RBS are themselves on one of those sides, the flipping never stops. The script
walks forward from the bar a level was born on, all the way to the present, applying every
break in order. Whatever side the level ends on is what you see.
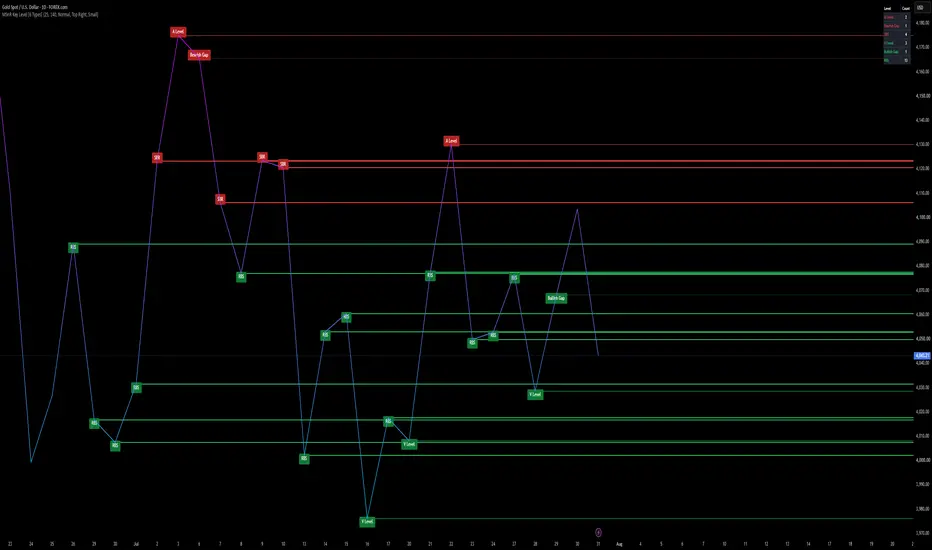
READING THE CHART
Color tells you the side:
- Red: resistance side, price has to close above to break it. A Level, Bearish Gap, SBR.
- Green: support side, price has to close below to break it. V Level, Bullish Gap, RBS.
Line weight tells you the strength:
- Thick solid: SBR and RBS. These have already been broken once and changed hands, which makes
them the levels most worth watching.
- Thin solid: A Level and V Level. A clean turning point between two opposite candles.
- Dotted: Bullish Gap and Bearish Gap. The most common and the weakest, formed by two candles
of the same colour.
That gives all six types a unique signature. A thick red line is an SBR, a dotted green line is
a Bullish Gap, and so on, without reading a single label.
Each line starts at the candle that set its price and extends to the right, so you can see how
price has behaved around it since. Its label sits at that same candle, above the line for a
resistance level and below it for a support level, so the label never covers the line itself.
A summary table in the corner counts each of the six types inside the current scan window, with
the three resistance-side types grouped above the three support-side types.
SETTINGS
Scan
- Scan Length: how many closed candles are scanned backwards. Every level inside that window is
drawn.
Level Types
- An individual switch for each of the six types. Hiding Bullish and Bearish Gap is the quickest
way to thin out a busy chart, since those are always the most numerous.
Style
- Resistance Side Color and Support Side Color.
Labels
- Show Labels, Label Offset in ticks, and Label Size. The offset is measured in ticks, so a
value that looks right on one symbol may need adjusting on another.
Summary Table
- Show, position and size of the corner table.
ALERTS
Six alert conditions are available: A Level, V Level, Bullish Gap, Bearish Gap, SBR and RBS.
Each message carries the level type, the symbol, the timeframe and the closing price. The same
messages are also sent through the alert function, so the "Any alert() function call" alert type
can deliver everything through a single alert.
All alerts are evaluated only after a candle has fully closed.
One thing worth knowing before you set these up: A Level, V Level, Bullish Gap and Bearish Gap
are created by EVERY candle pair, so those four alerts will fire on almost every bar. They are
there for completeness and for anyone feeding the data somewhere else. SBR and RBS only fire
when a level is actually broken, which makes them the two selective alerts of the six.
REPAINTING
This script does not repaint.
- Detection reads confirmed candles only. The scan starts one bar behind the latest bar, so the
candle that is still forming is never part of any calculation.
- Alert signals can only become true once a candle has finished. Price moving inside an open
candle cannot make a signal appear and then disappear.
- Levels are rebuilt on the last bar from confirmed history. A level's price never moves. Its
type can change, but only forward and only when a candle CLOSES through it, which is the whole
point of SBR and RBS. Once drawn, nothing shifts backwards.
When you create an alert, TradingView may show a caution banner saying the indicator can
repaint. That banner appears automatically for any script that uses the built in bar state
variables, no matter how they are used, because the platform cannot check the intent behind
them. This script uses them for the opposite purpose: one of them is what restricts every signal
to bar close, and the other is what redraws the levels efficiently on the final bar. Choosing
"Once Per Bar Close" when creating the alert is still recommended.
NOTES AND LIMITATIONS
- This chart is dense by design. Since every candle pair forms a level, a window of 25 candles
produces roughly 25 levels, and doubling the window doubles the lines. That is intentional,
because the point is a complete map rather than a shortlist. If you want fewer lines, lower
the Scan Length first, then switch off the Gap types.
- TradingView caps drawings at 500 lines and 500 labels. A very long Scan Length will hit that
ceiling and the oldest drawings will be dropped. The default is chosen to stay well inside it.
- The label offset is measured in ticks, and a tick is worth a very different amount on a crypto
pair than on a forex pair. Expect to adjust it when you move between symbols.
- Level prices come from closes, so a level can sit in the middle of a long wick. That is
deliberate, not a bug.
- Detection is purely structural. It reports where levels are and which way they have flipped.
It does not rank them by how many times price reacted, measure what happened afterwards, or
produce entries, targets or stops.
HOW TO USE IT
Read the chart in layers. The thick lines are the levels that have already proven they matter,
because price closed through them and the market treated them differently afterwards. The thin
lines are clean turning points. The dotted lines are background structure.
Levels that sit close together often matter more than any single one of them, since several
candle pairs agreeing on roughly one price is what a real zone looks like.
These are reference areas, not entry signals. Use them alongside higher timeframe structure, and
apply your own confirmation and risk management.
DISCLAIMER
This indicator is a level detection tool. It is not financial advice and it makes no claim about
profitability. Trading involves risk. Always apply your own analysis and risk management.
This script maps support and resistance the way market structure actually builds it: from the
close of one candle handing over to the next.
Every pair of consecutive candles leaves a level behind. Depending on the two candle colours
that level is an A Level, a V Level, a Bullish Gap or a Bearish Gap. From there the script
keeps watching. The moment price closes through a level, that level does not disappear, it
FLIPS: support that breaks downward becomes resistance (SBR), resistance that breaks upward
becomes support (RBS).
The result is a complete structural map of the scan window rather than a hand-picked list of
levels, with each of the six types drawn so it can be told apart at a glance.
WHAT MAKES THIS DIFFERENT
1. Complete coverage, not a filtered selection.
Most support and resistance tools try to guess which swing points matter and throw the rest
away. This one does the opposite: every candle pair inside the scan window produces a level,
and all of them are drawn. What separates the important levels from the ordinary ones is not
whether they are shown, but how they are drawn. A level that has already been broken and
flipped looks different from one that has never been touched.
2. Levels keep flipping, and the chart shows the CURRENT state.
A level is not classified once and left alone. It is re-checked against every candle that came
after it, and every close through it flips it again. A level that broke upward, then back down,
then upward again is reported as RBS, because that is what it is today. A tool that stops at
the first break would still be calling it by its original name.
3. Six types, six line signatures.
Line weight carries strength and line colour carries side, so a line still tells you what it is
even where labels crowd together.
4. The level price is the CLOSE, not the wick.
Every level sits at the close of the first candle in the pair. Closes are where the market
actually agreed on a price, which is why a close through a level counts as a break here while a
wick through it does not.
THE SIX LEVELS
A candle is Green when close is greater than open and Red when close is less than open. A Doji,
where close equals open, is neither and forms no level. Only fully closed candles are read; the
running candle is never used.
Created from a two candle pair, the level price being the close of the FIRST candle:
A Level
Green candle followed by a Red candle. Sits above as resistance.
V Level
Red candle followed by a Green candle. Sits below as support.
Bullish Gap
Green candle followed by another Green candle. Sits below as support.
Bearish Gap
Red candle followed by another Red candle. Sits above as resistance.
Created when an existing level is broken:
RBS - Resistance Become Support
An A Level or a Bearish Gap that a Green candle later CLOSED above. The old ceiling is now a
floor.
SBR - Support Become Resistance
A V Level or a Bullish Gap that a Red candle later CLOSED below. The old floor is now a ceiling.
HOW A LEVEL FLIPS
Think of every level as living on one of two sides.
Resistance side: A Level, Bearish Gap, SBR. Price has to CLOSE above it to break it, and doing
so turns it into RBS, which moves it to the support side.
Support side: V Level, Bullish Gap, RBS. Price has to CLOSE below it to break it, and doing so
turns it into SBR, which moves it to the resistance side.
Because SBR and RBS are themselves on one of those sides, the flipping never stops. The script
walks forward from the bar a level was born on, all the way to the present, applying every
break in order. Whatever side the level ends on is what you see.
READING THE CHART
Color tells you the side:
- Red: resistance side, price has to close above to break it. A Level, Bearish Gap, SBR.
- Green: support side, price has to close below to break it. V Level, Bullish Gap, RBS.
Line weight tells you the strength:
- Thick solid: SBR and RBS. These have already been broken once and changed hands, which makes
them the levels most worth watching.
- Thin solid: A Level and V Level. A clean turning point between two opposite candles.
- Dotted: Bullish Gap and Bearish Gap. The most common and the weakest, formed by two candles
of the same colour.
That gives all six types a unique signature. A thick red line is an SBR, a dotted green line is
a Bullish Gap, and so on, without reading a single label.
Each line starts at the candle that set its price and extends to the right, so you can see how
price has behaved around it since. Its label sits at that same candle, above the line for a
resistance level and below it for a support level, so the label never covers the line itself.
A summary table in the corner counts each of the six types inside the current scan window, with
the three resistance-side types grouped above the three support-side types.
SETTINGS
Scan
- Scan Length: how many closed candles are scanned backwards. Every level inside that window is
drawn.
Level Types
- An individual switch for each of the six types. Hiding Bullish and Bearish Gap is the quickest
way to thin out a busy chart, since those are always the most numerous.
Style
- Resistance Side Color and Support Side Color.
Labels
- Show Labels, Label Offset in ticks, and Label Size. The offset is measured in ticks, so a
value that looks right on one symbol may need adjusting on another.
Summary Table
- Show, position and size of the corner table.
ALERTS
Six alert conditions are available: A Level, V Level, Bullish Gap, Bearish Gap, SBR and RBS.
Each message carries the level type, the symbol, the timeframe and the closing price. The same
messages are also sent through the alert function, so the "Any alert() function call" alert type
can deliver everything through a single alert.
All alerts are evaluated only after a candle has fully closed.
One thing worth knowing before you set these up: A Level, V Level, Bullish Gap and Bearish Gap
are created by EVERY candle pair, so those four alerts will fire on almost every bar. They are
there for completeness and for anyone feeding the data somewhere else. SBR and RBS only fire
when a level is actually broken, which makes them the two selective alerts of the six.
REPAINTING
This script does not repaint.
- Detection reads confirmed candles only. The scan starts one bar behind the latest bar, so the
candle that is still forming is never part of any calculation.
- Alert signals can only become true once a candle has finished. Price moving inside an open
candle cannot make a signal appear and then disappear.
- Levels are rebuilt on the last bar from confirmed history. A level's price never moves. Its
type can change, but only forward and only when a candle CLOSES through it, which is the whole
point of SBR and RBS. Once drawn, nothing shifts backwards.
When you create an alert, TradingView may show a caution banner saying the indicator can
repaint. That banner appears automatically for any script that uses the built in bar state
variables, no matter how they are used, because the platform cannot check the intent behind
them. This script uses them for the opposite purpose: one of them is what restricts every signal
to bar close, and the other is what redraws the levels efficiently on the final bar. Choosing
"Once Per Bar Close" when creating the alert is still recommended.
NOTES AND LIMITATIONS
- This chart is dense by design. Since every candle pair forms a level, a window of 25 candles
produces roughly 25 levels, and doubling the window doubles the lines. That is intentional,
because the point is a complete map rather than a shortlist. If you want fewer lines, lower
the Scan Length first, then switch off the Gap types.
- TradingView caps drawings at 500 lines and 500 labels. A very long Scan Length will hit that
ceiling and the oldest drawings will be dropped. The default is chosen to stay well inside it.
- The label offset is measured in ticks, and a tick is worth a very different amount on a crypto
pair than on a forex pair. Expect to adjust it when you move between symbols.
- Level prices come from closes, so a level can sit in the middle of a long wick. That is
deliberate, not a bug.
- Detection is purely structural. It reports where levels are and which way they have flipped.
It does not rank them by how many times price reacted, measure what happened afterwards, or
produce entries, targets or stops.
HOW TO USE IT
Read the chart in layers. The thick lines are the levels that have already proven they matter,
because price closed through them and the market treated them differently afterwards. The thin
lines are clean turning points. The dotted lines are background structure.
Levels that sit close together often matter more than any single one of them, since several
candle pairs agreeing on roughly one price is what a real zone looks like.
These are reference areas, not entry signals. Use them alongside higher timeframe structure, and
apply your own confirmation and risk management.
DISCLAIMER
This indicator is a level detection tool. It is not financial advice and it makes no claim about
profitability. Trading involves risk. Always apply your own analysis and risk management.

Explore more trading tools & resources on my official website: rwbtradelab.com | Telegram: t.me/rwbtradelab
免責事項
これらの情報および投稿は、TradingViewが提供または承認する金融、投資、取引、またはその他の種類の助言もしくは推奨であることを意図したものではなく、またこれらに該当するものでもありません。詳細は利用規約をご覧ください。
Explore more trading tools & resources on my official website: rwbtradelab.com | Telegram: t.me/rwbtradelab
免責事項
これらの情報および投稿は、TradingViewが提供または承認する金融、投資、取引、またはその他の種類の助言もしくは推奨であることを意図したものではなく、またこれらに該当するものでもありません。詳細は利用規約をご覧ください。