OPEN-SOURCE SCRIPT
更新済 MACD Dive [TTM Squeeze | Dual Lock %R]
Disclaimer: This indicator is not financial advice and is strictly for educational and informational purposes only. The metrics and signals provided herein (including momentum crosses, trend saturation state icons, and squeeze markers) are calculated based on historical market data and do not guarantee future performance. Trading stocks and commodities involves significant risk of loss. The user assumes full responsibility for all trading decisions and should always perform their own due diligence before executing trades.
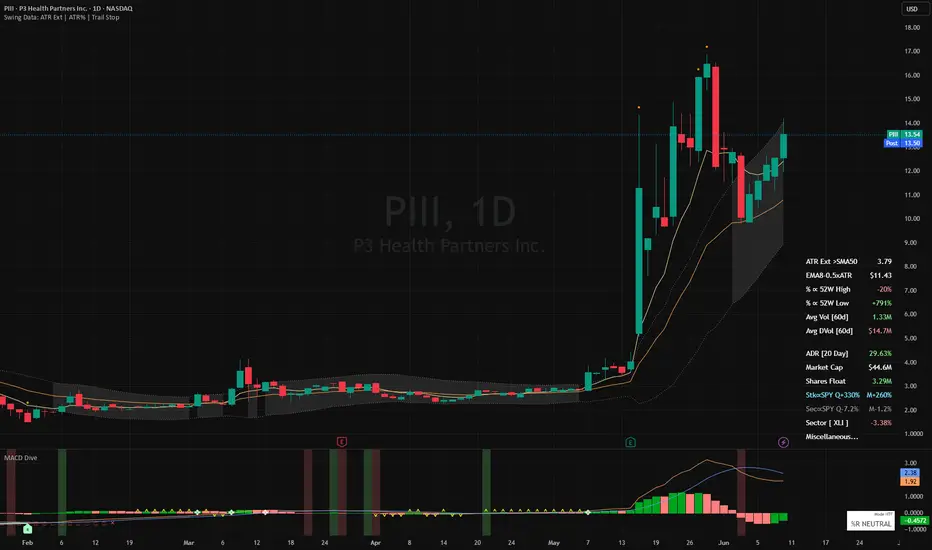
MACD Dive is a multi-state momentum and volatility context engine. By layering momentum oscillation (MACD/PPO/MACD-V) with market stalemates (volatility squeeze) and trend exhaustion (Dual %R saturation), this suite transforms a standard MACD into a multi-dimensional 'No-Go' gatekeeper. This synergy is what gives the engine its edge: it actively blocks the trader from whipsawing in sideways chop or buying into a dying trend, highlighting high-probability market turns where momentum, volatility, and trend capacity perfectly align.
Standard oscillators have a scaling problem. This script lets you choose your engine:
Adaptive Time-Frames & RSI Gatekeeper
Think of this as an automated gear shifter. When looking at lower timeframes (below a user-defined boundary, e.g. 1 hour), the engine automatically scales down to tight, agile lookback periods. When viewing high timeframes, it dials up to filter out noise.
Buying a bullish MACD cross when the RSI is already at 85 increases risk of buying the top when the tank is empty. The optional RSI Safety Filter acts as a strict ceiling/floor blocker. If momentum crosses upward but the asset is mathematically overbought, the indicator suppresses the background highlight. It prevents signals on MACD crosses that have no fuel left.
VOLATILITY ENGINE: BB-KC Squeeze Radar
Building on John Carter’s TTM Squeeze by mapping the contraction of Bollinger Bands inside Keltner Channels to identify market stalemates. The implementation here color codes between a Loose Squeeze (BB inside 1.5 KC) and a hyper-compressed Tight Squeeze (BB inside 1.0 KC) to show the staged intensity of the coiled spring.
While the market coils sideways, a 20-period Linear Regression calculates the trajectory of price deviation inside the bands. The directional bias is shown by customizable markers on the zero line (default ⌃ or ⌄). This reveals hidden institutional accumulation or distribution before the trigger is pulled. To bypass "dead money" risk, the script tracks the first clean candle close or intraday pierce outside the Keltner bounds following a squeeze, catching the expansion phase exactly as it starts.
Furthermore, it accounts for the "Disappearing Mark" phenomenon. Bollinger Bands expand instantly when price moves, causing standard squeeze signals to vanish 1-3 bars before the real breakout candle. This script uses a memory state to remember recent compression, firing a "squeeze release" marker (default ❖) the exact moment price closes outside the Keltner bounds. Trade the release, not the waiting room.
Note: While MACD Dive tracks this compression mathematically on its zero-line, you can see the actual physical boundaries of the breakout by pairing it with my companion Swing Data suite. Plotting its Keltner Channel at 1.5 multiplier over your price chart allows you to visually verify the exact moment the squeeze release mark is ignited.
SATURATION ENGINE: Dual-Lock %R and Momentum Rot
This suite tracks sustained trend maturity using a fast/slow dual Williams %R setup. The conceptual pairing of a fast and slow %R to identify overbought/oversold exhaustion is credited to upslidedown's excellent Trend Exhaustion indicator. I highly recommend applying their script to your chart if you want to visually learn how the two %R lines interact.
While upslidedown’s implementation offers multiple display modes to paint visual boxes and exhaustion zones directly over price action, the focus here is on the discrete icons for trend status at the top and bottom of the MACD pane: Ignition (·), Saturation (□), and Fatigue (×). This suite adapts native ta.wpr() math assuming the trader is already familiar with Dual %R mechanics. Specific "Sprint" and "Marathon" tuning guidance is provided in the tooltips: heavily smoothing the fast line to ignore intraday noise, while lightly smoothing the macro slow line to preserve its reach into extreme zones.
It also features one major addition: the Stall. While Dual %R tracks Price Location (confirming price is structurally pinned at the highs), it doesn't track Velocity (confirming energy is sustained). To solve this, a Stoch RSI "Rot" detector runs quietly inside the saturation state. If price continues to float at the highs but internal velocity drops below a critical threshold, the script overlays a Stall marker (•). Designed as a "one-shot" early warning, it fires only on the first detection per trend saturation leg to prevent chart clutter. This differentiates a strong trend lock from a rotting lock, warning us that the move is running on fumes: giving us the exact cue to tighten stops, trim into parabolic strength, and strictly avoid adding new size.
BACKTESTER READY
Out-of-the-box compatibility with a comprehensive built-in README guide is available directly inside the settings menu. For traders who prefer a "Diamond Hands" approach, the indicator fully maps to Jason5480's TTS Framework convention, outputting strict integer states (1, -1, 2, -2) to hold full position size until the trailing macro baseline completely fractures. My personal backtester, Cosmos Signal Commander (which may be released to the public in the future), broadcasts a composite float signal capable of managing active trade positioning. It tracks entries, hard stops, and partial take-profits (swapping the trailing stop from tight to a wide "runner" buffer upon hitting extended ATR targets).
PERFORMANCE OPTIMIZATION
MACD Dive is a multi-state momentum and volatility context engine. By layering momentum oscillation (MACD/PPO/MACD-V) with market stalemates (volatility squeeze) and trend exhaustion (Dual %R saturation), this suite transforms a standard MACD into a multi-dimensional 'No-Go' gatekeeper. This synergy is what gives the engine its edge: it actively blocks the trader from whipsawing in sideways chop or buying into a dying trend, highlighting high-probability market turns where momentum, volatility, and trend capacity perfectly align.
Standard oscillators have a scaling problem. This script lets you choose your engine:
- MACD (Classic): Measures momentum in absolute dollars. Great for visual reactivity, but a "2.0" reading means something different on a $5 stock versus a $500 stock.
- PPO (Percentage): Measures momentum in percentages. Standardizes the reading across all assets, making it ideal for fixed-rule algorithmic trading.
- MACD-V (Volatility Normalized): This divides the MACD by the Average True Range (ATR). It measures momentum in "Units of Volatility," mathematically adapting to market chaos so that signals remain consistent across both different assets and shifting volatility regimes (quiet markets vs chaotic markets).
- Regular Divergence (Solid Lines): Identifies Trend Reversals. Price pushes to a new extreme, but momentum fails to follow, signaling exhaustion.
- Hidden Divergence (Dashed Lines): Identifies Trend Continuations (Slingshots). Price pulls back, but momentum fully resets, signaling a high-probability entry in the direction of the dominant trend.
Adaptive Time-Frames & RSI Gatekeeper
Think of this as an automated gear shifter. When looking at lower timeframes (below a user-defined boundary, e.g. 1 hour), the engine automatically scales down to tight, agile lookback periods. When viewing high timeframes, it dials up to filter out noise.
Buying a bullish MACD cross when the RSI is already at 85 increases risk of buying the top when the tank is empty. The optional RSI Safety Filter acts as a strict ceiling/floor blocker. If momentum crosses upward but the asset is mathematically overbought, the indicator suppresses the background highlight. It prevents signals on MACD crosses that have no fuel left.
VOLATILITY ENGINE: BB-KC Squeeze Radar
Building on John Carter’s TTM Squeeze by mapping the contraction of Bollinger Bands inside Keltner Channels to identify market stalemates. The implementation here color codes between a Loose Squeeze (BB inside 1.5 KC) and a hyper-compressed Tight Squeeze (BB inside 1.0 KC) to show the staged intensity of the coiled spring.
While the market coils sideways, a 20-period Linear Regression calculates the trajectory of price deviation inside the bands. The directional bias is shown by customizable markers on the zero line (default ⌃ or ⌄). This reveals hidden institutional accumulation or distribution before the trigger is pulled. To bypass "dead money" risk, the script tracks the first clean candle close or intraday pierce outside the Keltner bounds following a squeeze, catching the expansion phase exactly as it starts.
Furthermore, it accounts for the "Disappearing Mark" phenomenon. Bollinger Bands expand instantly when price moves, causing standard squeeze signals to vanish 1-3 bars before the real breakout candle. This script uses a memory state to remember recent compression, firing a "squeeze release" marker (default ❖) the exact moment price closes outside the Keltner bounds. Trade the release, not the waiting room.
Note: While MACD Dive tracks this compression mathematically on its zero-line, you can see the actual physical boundaries of the breakout by pairing it with my companion Swing Data suite. Plotting its Keltner Channel at 1.5 multiplier over your price chart allows you to visually verify the exact moment the squeeze release mark is ignited.
SATURATION ENGINE: Dual-Lock %R and Momentum Rot
This suite tracks sustained trend maturity using a fast/slow dual Williams %R setup. The conceptual pairing of a fast and slow %R to identify overbought/oversold exhaustion is credited to upslidedown's excellent Trend Exhaustion indicator. I highly recommend applying their script to your chart if you want to visually learn how the two %R lines interact.
While upslidedown’s implementation offers multiple display modes to paint visual boxes and exhaustion zones directly over price action, the focus here is on the discrete icons for trend status at the top and bottom of the MACD pane: Ignition (·), Saturation (□), and Fatigue (×). This suite adapts native ta.wpr() math assuming the trader is already familiar with Dual %R mechanics. Specific "Sprint" and "Marathon" tuning guidance is provided in the tooltips: heavily smoothing the fast line to ignore intraday noise, while lightly smoothing the macro slow line to preserve its reach into extreme zones.
It also features one major addition: the Stall. While Dual %R tracks Price Location (confirming price is structurally pinned at the highs), it doesn't track Velocity (confirming energy is sustained). To solve this, a Stoch RSI "Rot" detector runs quietly inside the saturation state. If price continues to float at the highs but internal velocity drops below a critical threshold, the script overlays a Stall marker (•). Designed as a "one-shot" early warning, it fires only on the first detection per trend saturation leg to prevent chart clutter. This differentiates a strong trend lock from a rotting lock, warning us that the move is running on fumes: giving us the exact cue to tighten stops, trim into parabolic strength, and strictly avoid adding new size.
BACKTESTER READY
Out-of-the-box compatibility with a comprehensive built-in README guide is available directly inside the settings menu. For traders who prefer a "Diamond Hands" approach, the indicator fully maps to Jason5480's TTS Framework convention, outputting strict integer states (1, -1, 2, -2) to hold full position size until the trailing macro baseline completely fractures. My personal backtester, Cosmos Signal Commander (which may be released to the public in the future), broadcasts a composite float signal capable of managing active trade positioning. It tracks entries, hard stops, and partial take-profits (swapping the trailing stop from tight to a wide "runner" buffer upon hitting extended ATR targets).
PERFORMANCE OPTIMIZATION
- O(1) Memory States: Replaced lag-heavy ta.barssince() and 50-bar for loops in the Divergence engine with O(1) var state trackers.
- String Caching: HUD table strings are built once in the global var scope to prevent constant memory allocation and garbage collection lag.
- UI Mutation: The HUD uses table.cell_set_* to alter data dynamically, bypassing the stutter caused by destroying and redrawing tables on every tick.
- Native C++ Backend: Replaced custom highest/lowest math arrays with native ta.wpr() functions for the %R engine to maximize computation speed.
- Ghost State Resets: When switching the backtester logic to "Long Only" mode, the engine actively hunts and kills lingering short-memory variables so they don't inadvertently suppress valid long signals.
リリースノート
OPTIMIZATION O(1) Evaluation of Static VariablesTimeframe detection logic and global color constants were refactored to use the var keyword. Previously, the engine calculated the timeframe multiplier and assessed the is_ltf boolean on every single tick. By defining these with var, the script now caches these parameters into memory on bar zero.
OPTIMIZATION Elastic HUD Table
Original script pre-allocated fixed cells and mutated them using table.cell_set_*, which left empty white space ("dead rows") on the chart when a signal (like a MACD cross or Squeeze) decayed. Updated script implements a dynamic row index pointer (rIdx) that stacks active signals sequentially.
To prevent graphical artifacts, an auto-shrink garbage collector was added to the end of the logic tree. It actively destroys stale rows, forcing the HUD to snap tight to its anchor point.
Credits for Technical Concepts
Some of the technical concepts used in this open-source Pine Script implementation are credited to the individuals below.
- ATR & RSI: J. Welles Wilder Jr.
- Bollinger Bands: John Bollinger
- Keltner Channels: original by Chester W. Keltner, later modified by the legendary Linda Raschke which made the TTM Squeeze mathematically possible
- TTM Squeeze: John Carter
- MACD & PPO: Gerald Appel
- MACD-V: Alex Spiroglou, received awards from NAAIM & CMTA
- Williams %R: Larry Williams
- Dual Lock %R: TradingView author upslidedown
- Stochastic RSI: Tushar Chande and Stanley Kroll
オープンソーススクリプト
TradingViewの精神に則り、このスクリプトの作者はコードをオープンソースとして公開してくれました。トレーダーが内容を確認・検証できるようにという配慮です。作者に拍手を送りましょう!無料で利用できますが、コードの再公開はハウスルールに従う必要があります。

免責事項
これらの情報および投稿は、TradingViewが提供または承認する金融、投資、取引、またはその他の種類の助言もしくは推奨であることを意図したものではなく、またこれらに該当するものでもありません。詳細は利用規約をご覧ください。
オープンソーススクリプト
TradingViewの精神に則り、このスクリプトの作者はコードをオープンソースとして公開してくれました。トレーダーが内容を確認・検証できるようにという配慮です。作者に拍手を送りましょう!無料で利用できますが、コードの再公開はハウスルールに従う必要があります。
免責事項
これらの情報および投稿は、TradingViewが提供または承認する金融、投資、取引、またはその他の種類の助言もしくは推奨であることを意図したものではなく、またこれらに該当するものでもありません。詳細は利用規約をご覧ください。