SellSide BuySide NomadaScalper
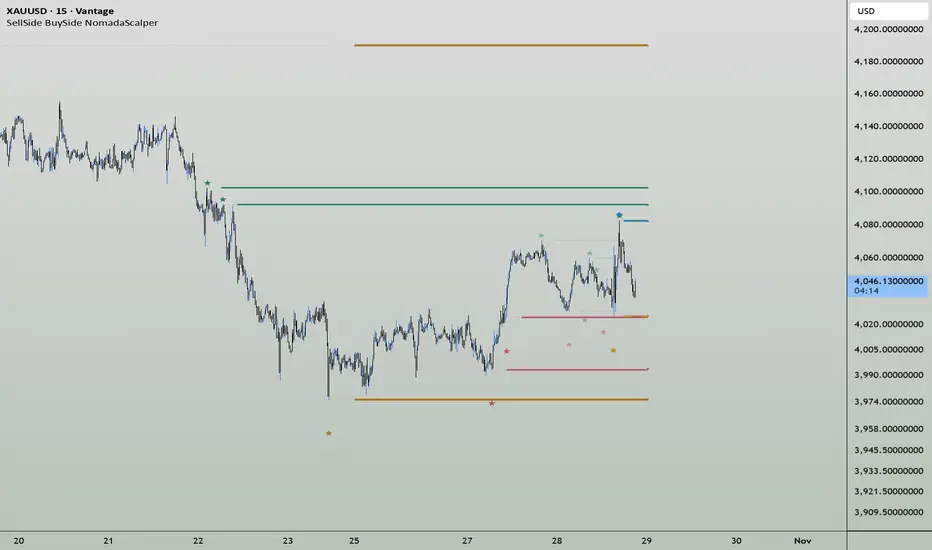
SellSide BuySide NomadaScalper maps untested highs and lows from completed four-hour candles, together with the previous day’s and previous week’s extremes. It provides a structured reference for observing how price approaches and interacts with earlier candle boundaries.
Each completed four-hour candle contributes its high and low after confirmation. These levels become available during the following four-hour interval. The indicator monitors retained levels and displays the nearest untested highs and lows to keep the chart focused.
By default, the map displays three untested levels per side, retains a rolling window of 120 four-hour source candles, and shows six recently reached levels. These settings are adjustable. Limiting the number of visible levels does not stop the indicator from monitoring other records within the retained window.
A high is marked as reached when a subsequent chart candle’s high reaches or exceeds its exact price. A low is marked as reached when a subsequent candle’s low reaches or falls below it. A candle body close is not required. Gaps beyond a level also count as reached, even when no trade at that exact price can be established from the chart data. Once reached, the level stops extending.
The visual map includes:
• Green four-hour highs and red four-hour lows.
• A blue previous-day high and yellow previous-day low.
• Gold previous-week highs and lows.
• Optional narrow decorative bands and origin stars with hover information.
• Adjustable right projection and a limited selection of recently reached levels.
The decorative bands occupy 2.5% of their source candle’s range. They do not modify the actual level price or its contact condition. Coincident four-hour prices are combined visually, while their underlying records remain independently monitored.
Only completed source candles supply level prices. Origin stars and dotted segments may point back to the candle where an extreme formed, but they appear only after source confirmation. This is retrospective context, not an indication that the level was available at that earlier moment. When the exact origin cannot be identified from loaded chart bars, the marker uses the level’s availability time.
Daily and weekly references follow the symbol’s TradingView exchange and session data. They are not custom midnight or regular-session calculations. Each reference stops extending after contact and remains visible until replaced by the next completed period.
Use standard time-based charts at four hours or below, with intervals that divide evenly into four hours, such as 1, 3, 5, 15 or 30 minutes, or 1, 2 or 4 hours. Available history and the selected retention window determine which levels can be tracked.
“High reached” and “Low reached” alerts monitor retained four-hour levels, including levels outside the visible selection. Daily and weekly references do not trigger these alerts. Contact detection updates with the current chart candle.
The indicator combines proximity-based selection, contact tracking and clearly distinguished source origins in one level map. Buy-side and sell-side terminology refers to price extremes commonly studied as potential liquidity references. The script does not access resting orders or order-book data, verify liquidity concentrations, calculate probabilities, or generate trade-entry recommendations.
Each completed four-hour candle contributes its high and low after confirmation. These levels become available during the following four-hour interval. The indicator monitors retained levels and displays the nearest untested highs and lows to keep the chart focused.
By default, the map displays three untested levels per side, retains a rolling window of 120 four-hour source candles, and shows six recently reached levels. These settings are adjustable. Limiting the number of visible levels does not stop the indicator from monitoring other records within the retained window.
A high is marked as reached when a subsequent chart candle’s high reaches or exceeds its exact price. A low is marked as reached when a subsequent candle’s low reaches or falls below it. A candle body close is not required. Gaps beyond a level also count as reached, even when no trade at that exact price can be established from the chart data. Once reached, the level stops extending.
The visual map includes:
• Green four-hour highs and red four-hour lows.
• A blue previous-day high and yellow previous-day low.
• Gold previous-week highs and lows.
• Optional narrow decorative bands and origin stars with hover information.
• Adjustable right projection and a limited selection of recently reached levels.
The decorative bands occupy 2.5% of their source candle’s range. They do not modify the actual level price or its contact condition. Coincident four-hour prices are combined visually, while their underlying records remain independently monitored.
Only completed source candles supply level prices. Origin stars and dotted segments may point back to the candle where an extreme formed, but they appear only after source confirmation. This is retrospective context, not an indication that the level was available at that earlier moment. When the exact origin cannot be identified from loaded chart bars, the marker uses the level’s availability time.
Daily and weekly references follow the symbol’s TradingView exchange and session data. They are not custom midnight or regular-session calculations. Each reference stops extending after contact and remains visible until replaced by the next completed period.
Use standard time-based charts at four hours or below, with intervals that divide evenly into four hours, such as 1, 3, 5, 15 or 30 minutes, or 1, 2 or 4 hours. Available history and the selected retention window determine which levels can be tracked.
“High reached” and “Low reached” alerts monitor retained four-hour levels, including levels outside the visible selection. Daily and weekly references do not trigger these alerts. Contact detection updates with the current chart candle.
The indicator combines proximity-based selection, contact tracking and clearly distinguished source origins in one level map. Buy-side and sell-side terminology refers to price extremes commonly studied as potential liquidity references. The script does not access resting orders or order-book data, verify liquidity concentrations, calculate probabilities, or generate trade-entry recommendations.

NomadaScalper
免責事項
これらの情報および投稿は、TradingViewが提供または承認する金融、投資、取引、またはその他の種類の助言もしくは推奨であることを意図したものではなく、またこれらに該当するものでもありません。詳細は利用規約をご覧ください。
NomadaScalper
免責事項
これらの情報および投稿は、TradingViewが提供または承認する金融、投資、取引、またはその他の種類の助言もしくは推奨であることを意図したものではなく、またこれらに該当するものでもありません。詳細は利用規約をご覧ください。