OPEN-SOURCE SCRIPT
True Order Blocks & Liquidity Levels
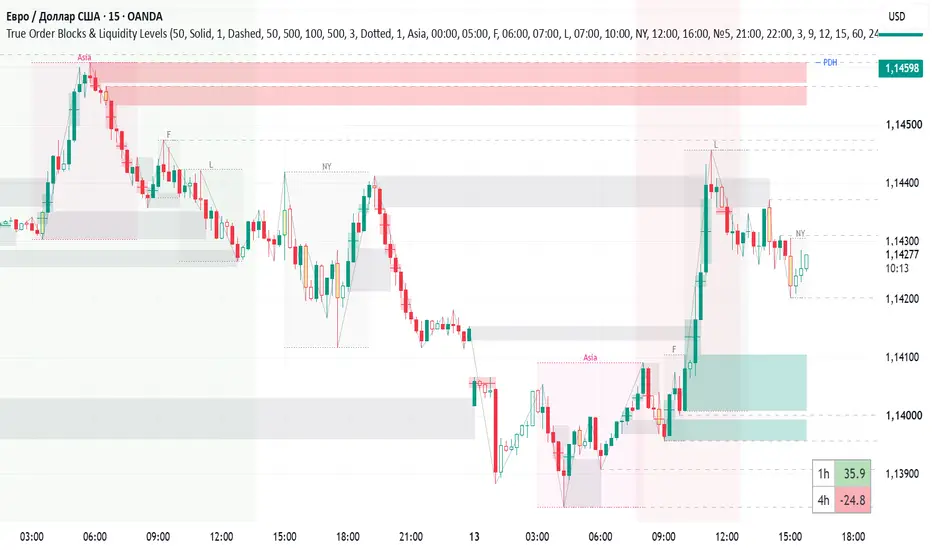
True Order Blocks & Liquidity Levels — a comprehensive price action toolkit for market structure analysis, liquidity mapping, and institutional zone detection across any instrument and timeframe.
The logic behind order blocks, imbalances, and internal pullbacks is built in strict accordance with the inside bar methodology — one of the most precise approaches to identifying institutional points of interest. Every module accounts for whether a bar is an inside bar, which significantly improves signal quality and eliminates false zones that commonly appear with traditional approaches.
━━━━━━━━━━━━━━━━━━━━━━━━━━━━━━━━━━━━━━━━
MODULES
━━━━━━━━━━━━━━━━━━━━━━━━━━━━━━━━━━━━━━━━
▸ Internal Pullbacks
Displays market structure as lines connecting sequential pivot highs and lows. Inside bars are ignored during structure building, keeping pullback lines clean and noise-free. The last open line redraws in real time as price develops.
▸ Internal Liquidity
Horizontal lines automatically placed at each confirmed pivot high and low. A line persists until price crosses it — at that moment the line is removed and an alert fires. These levels mark clusters of stop orders and serve as potential targets for liquidity sweeps.
▸ Imbalance (FVG)
Fair Value Gap detector built on three consecutive non-inside bars. The algorithm steps over inside bars when searching for the FVG — this means the gap can span more than 3 candles visually if inside bars appear in between, which is intentional and produces cleaner zones. Open-price gaps are handled by clipping FVG boundaries to the body of the middle candle.
▸ Order Blocks
Institutional interest zones formed by a strict algorithm: an order block is drawn only when the bar preceding a FVG performed a liquidity sweep — meaning it broke the high or low of the prior significant pivot. The block is placed on the candle immediately preceding the impulsive move. If an absorption candle stands between the OB candidate and the FVG, the candidate is reset — preventing false blocks from forming on overly aggressive moves.
▸ Inside Bars
Highlights bars that fit entirely within the range of the previous mother candle. A series of consecutive inside bars signals compression and accumulation ahead of a directional move.
▸ Absorption
Marks candles that fully engulf the range of the previous mother candle (high > mother high and low < mother low). These candles often indicate absorption of accumulated positions and a short-term shift in intent.
▸ PDH / PDL — Previous Day High & Low
Displays high and low levels from previous trading days (up to 7 days). Levels that have been fully engulfed by price are automatically hidden. Each level is labeled: the most recent is marked "PDH" / "PDL", older ones show the date in month/day format.
▸ Market Sessions
Draws session boxes for each trading session over the last N days. Five fully independent sessions are supported — defaults are Asia, Frankfurt, London, New York, and one custom user-defined session.
━━━━━━━━━━━━━━━━━━━━━━━━━━━━━━━━━━━━━━━━
TREND FILTER
━━━━━━━━━━━━━━━━━━━━━━━━━━━━━━━━━━━━━━━━
Colors the chart background based on WaveTrend oscillator alignment across up to three independent timeframes. When all selected timeframes show WT above zero simultaneously — bullish background. When all show WT below zero — bearish background. When timeframes disagree — no background, signalling an unclear or transitional market state.
How WaveTrend is calculated: WT is built as a double-smoothed normalized channel index on HLC3. The first EMA measures the average deviation of price from its mean; the result is normalized and smoothed again to produce the final oscillator value. Values above zero indicate bullish bias, below zero — bearish.
━━━━━━━━━━━━━━━━━━━━━━━━━━━━━━━━━━━━━━━━
DASHBOARD
━━━━━━━━━━━━━━━━━━━━━━━━━━━━━━━━━━━━━━━━
A compact table showing WaveTrend values for each enabled timeframe. Only enabled timeframes are displayed — from one to three rows.
━━━━━━━━━━━━━━━━━━━━━━━━━━━━━━━━━━━━━━━━
ALERTS
━━━━━━━━━━━━━━━━━━━━━━━━━━━━━━━━━━━━━━━━
Every module has its own independent alert toggle. All messages can optionally be prefixed with the instrument ticker — useful when monitoring multiple charts simultaneously.
The logic behind order blocks, imbalances, and internal pullbacks is built in strict accordance with the inside bar methodology — one of the most precise approaches to identifying institutional points of interest. Every module accounts for whether a bar is an inside bar, which significantly improves signal quality and eliminates false zones that commonly appear with traditional approaches.
━━━━━━━━━━━━━━━━━━━━━━━━━━━━━━━━━━━━━━━━
MODULES
━━━━━━━━━━━━━━━━━━━━━━━━━━━━━━━━━━━━━━━━
▸ Internal Pullbacks
Displays market structure as lines connecting sequential pivot highs and lows. Inside bars are ignored during structure building, keeping pullback lines clean and noise-free. The last open line redraws in real time as price develops.
- Adjustable number of visible lines
- Color, style (solid / dashed / dotted) and width customization
▸ Internal Liquidity
Horizontal lines automatically placed at each confirmed pivot high and low. A line persists until price crosses it — at that moment the line is removed and an alert fires. These levels mark clusters of stop orders and serve as potential targets for liquidity sweeps.
- Independent limit on the number of visible levels
- Color and style customization
- Alert on level breach
▸ Imbalance (FVG)
Fair Value Gap detector built on three consecutive non-inside bars. The algorithm steps over inside bars when searching for the FVG — this means the gap can span more than 3 candles visually if inside bars appear in between, which is intentional and produces cleaner zones. Open-price gaps are handled by clipping FVG boundaries to the body of the middle candle.
- Separate colors for bullish and bearish FVG zones
- Maximum number of displayed zones
- Midline drawn inside each zone for easier reference
▸ Order Blocks
Institutional interest zones formed by a strict algorithm: an order block is drawn only when the bar preceding a FVG performed a liquidity sweep — meaning it broke the high or low of the prior significant pivot. The block is placed on the candle immediately preceding the impulsive move. If an absorption candle stands between the OB candidate and the FVG, the candidate is reset — preventing false blocks from forming on overly aggressive moves.
- Automatic mitigation tracking: when price touches the zone, the block changes to a "mitigated" color
- Option to hide mitigated blocks entirely
- Separate colors for bullish, bearish, and mitigated blocks
- Adjustable history depth
- Alerts on new block formation and on mitigation
▸ Inside Bars
Highlights bars that fit entirely within the range of the previous mother candle. A series of consecutive inside bars signals compression and accumulation ahead of a directional move.
- Barcolor highlight with customizable color
- Adjustable lookback depth
▸ Absorption
Marks candles that fully engulf the range of the previous mother candle (high > mother high and low < mother low). These candles often indicate absorption of accumulated positions and a short-term shift in intent.
- Separate highlight color independent of Inside Bars
- Alert on absorption candle formation
▸ PDH / PDL — Previous Day High & Low
Displays high and low levels from previous trading days (up to 7 days). Levels that have been fully engulfed by price are automatically hidden. Each level is labeled: the most recent is marked "PDH" / "PDL", older ones show the date in month/day format.
- Adjustable number of days displayed
- Unified color for all PDH/PDL levels
- Alert when price crosses a level
▸ Market Sessions
Draws session boxes for each trading session over the last N days. Five fully independent sessions are supported — defaults are Asia, Frankfurt, London, New York, and one custom user-defined session.
- Custom name, start and end time (UTC), and background color per session
- Optional horizontal border lines showing session high and low
- Border style and width customization
- Adjustable display depth (number of days)
- Alerts when price crosses the high or low of a closed session
━━━━━━━━━━━━━━━━━━━━━━━━━━━━━━━━━━━━━━━━
TREND FILTER
━━━━━━━━━━━━━━━━━━━━━━━━━━━━━━━━━━━━━━━━
Colors the chart background based on WaveTrend oscillator alignment across up to three independent timeframes. When all selected timeframes show WT above zero simultaneously — bullish background. When all show WT below zero — bearish background. When timeframes disagree — no background, signalling an unclear or transitional market state.
How WaveTrend is calculated: WT is built as a double-smoothed normalized channel index on HLC3. The first EMA measures the average deviation of price from its mean; the result is normalized and smoothed again to produce the final oscillator value. Values above zero indicate bullish bias, below zero — bearish.
- Show trend filter — master on/off switch
- WT Channel Length — EMA length for channel calculation. Shorter = more reactive
- WT Average Length — smoothing EMA applied on top. Larger = calmer signal
- TF 1 / TF 2 / TF 3 — each row has an enable toggle and a timeframe selector. Defaults: 15m, 1h, 4h. A disabled timeframe is treated as neutral and excluded from alignment check
- Confirm trend on bar close — when enabled, background and alerts only react to values from the last closed HTF bar, eliminating intra-bar repainting. When disabled, the background updates in real time as the HTF bar forms
- Bullish / Bearish background colors — customizable with transparency
- Trend Changed alert — fires on bar close on any of the six possible state transitions: uptrend ↔ neutral ↔ downtrend and direct flip. Alert message specifies the exact transition
━━━━━━━━━━━━━━━━━━━━━━━━━━━━━━━━━━━━━━━━
DASHBOARD
━━━━━━━━━━━━━━━━━━━━━━━━━━━━━━━━━━━━━━━━
A compact table showing WaveTrend values for each enabled timeframe. Only enabled timeframes are displayed — from one to three rows.
- Column 1: timeframe label (15m, 1h, 4h etc.)
- Column 2: current WT value rounded to one decimal. Cell background reflects signal strength: neutral grey (−10 to +10), weak green/red (±10 to ±40), saturated green/red (beyond ±40)
- Position — 9 placement options across the chart
- Text size — Tiny / Small / Normal / Large
━━━━━━━━━━━━━━━━━━━━━━━━━━━━━━━━━━━━━━━━
ALERTS
━━━━━━━━━━━━━━━━━━━━━━━━━━━━━━━━━━━━━━━━
Every module has its own independent alert toggle. All messages can optionally be prefixed with the instrument ticker — useful when monitoring multiple charts simultaneously.
- Liquidity level breached
- Absorption candle formed
- New order block created
- Order block mitigated
- Session high or low crossed
- PDH / PDL level crossed
- Trend changed (WaveTrend multi-TF)
オープンソーススクリプト
TradingViewの精神に則り、このスクリプトの作者はコードをオープンソースとして公開してくれました。トレーダーが内容を確認・検証できるようにという配慮です。作者に拍手を送りましょう!無料で利用できますが、コードの再公開はハウスルールに従う必要があります。

免責事項
これらの情報および投稿は、TradingViewが提供または承認する金融、投資、取引、またはその他の種類の助言もしくは推奨であることを意図したものではなく、またこれらに該当するものでもありません。詳細は利用規約をご覧ください。
オープンソーススクリプト
TradingViewの精神に則り、このスクリプトの作者はコードをオープンソースとして公開してくれました。トレーダーが内容を確認・検証できるようにという配慮です。作者に拍手を送りましょう!無料で利用できますが、コードの再公開はハウスルールに従う必要があります。
免責事項
これらの情報および投稿は、TradingViewが提供または承認する金融、投資、取引、またはその他の種類の助言もしくは推奨であることを意図したものではなく、またこれらに該当するものでもありません。詳細は利用規約をご覧ください。