OPEN-SOURCE SCRIPT
GME Quarterly OPEX Analysis
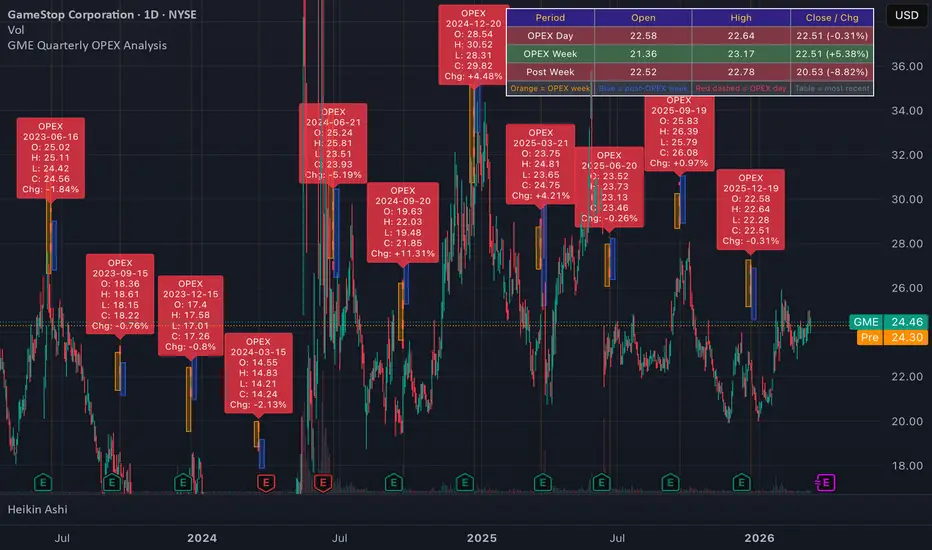
**GME Quarterly OPEX Analyzer** — marks every quarterly expiration date (3rd Friday of March, June, September, December) on a GME daily chart going back as far as chart data allows. For each OPEX it draws a red dashed vertical line, labels the day's OHLC and % change, shades the full OPEX week in orange, and shades the following week in blue. A table in the top-right shows the most recent OPEX day, OPEX week, and post-OPEX week OHLC with color-coded green/red results. Useful for visually identifying whether quarterly OPEX dates correlate with local price bottoms, tops, or reversals over time.
オープンソーススクリプト
TradingViewの精神に則り、このスクリプトの作者はコードをオープンソースとして公開してくれました。トレーダーが内容を確認・検証できるようにという配慮です。作者に拍手を送りましょう!無料で利用できますが、コードの再公開はハウスルールに従う必要があります。

免責事項
これらの情報および投稿は、TradingViewが提供または承認する金融、投資、取引、またはその他の種類の助言もしくは推奨であることを意図したものではなく、またこれらに該当するものでもありません。詳細は利用規約をご覧ください。
オープンソーススクリプト
TradingViewの精神に則り、このスクリプトの作者はコードをオープンソースとして公開してくれました。トレーダーが内容を確認・検証できるようにという配慮です。作者に拍手を送りましょう!無料で利用できますが、コードの再公開はハウスルールに従う必要があります。
免責事項
これらの情報および投稿は、TradingViewが提供または承認する金融、投資、取引、またはその他の種類の助言もしくは推奨であることを意図したものではなく、またこれらに該当するものでもありません。詳細は利用規約をご覧ください。