OPEN-SOURCE SCRIPT
更新済 Weekly Stochastic
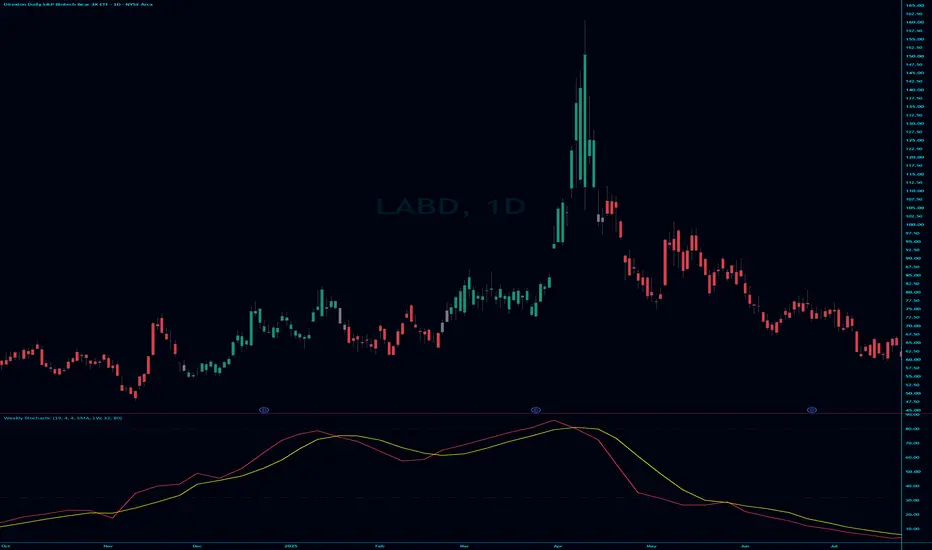
Color of candles depended on the trend. when K crosses over candles are green. when k crosses under candles are red
リリースノート
**Weekly Stochastic Trend Tracker**This indicator is designed to identify and highlight major macro trends by using a custom Weekly Stochastic oscillator (19, 4, 4) overlaid onto your current chart. It filters out market noise by applying a strict 4-step state machine to color your candles, ensuring you only see trend signals when momentum is fully confirmed.
**How it Works:**
The indicator calculates a Weekly Stochastic and colors the chart candles based on the following cycle:
* **Gray (Neutral/Shift):** Occurs immediately when the Stochastic `%K` crosses over or under `%D`, signaling a potential momentum shift.
* **Green (Confirmed Uptrend):** After a bullish cross, if `%K` holds above the 32 level for 3 consecutive bars, the candles turn Green to signal a strong uptrend.
* **Red (Confirmed Downtrend):** After a bearish cross, if `%K` stays below 80 and below `%D` for 3 consecutive bars, the candles turn Red to signal a strong downtrend.
**Features:**
* **Multi-Timeframe (MTF):** Operates on weekly data regardless of your chart's timeframe.
* **Non-Repainting Logic:** By default, it waits for the weekly candle to close before locking in signals.
* **Visual Smoothing:** Includes an interpolation toggle to display smooth, straight lines connecting the weekly data points instead of jagged steps on lower timeframes.
* **Custom Smoothing Types:** Allows you to change the Stochastic smoothing calculation (SMA, EMA, WMA, RMA) to fit your preference.
This tool is ideal for swing traders and trend followers looking to stay on the right side of the weekly momentum.
リリースノート
I fixed a couple bugs with the grey barsオープンソーススクリプト
TradingViewの精神に則り、このスクリプトの作者はコードをオープンソースとして公開してくれました。トレーダーが内容を確認・検証できるようにという配慮です。作者に拍手を送りましょう!無料で利用できますが、コードの再公開はハウスルールに従う必要があります。

免責事項
これらの情報および投稿は、TradingViewが提供または承認する金融、投資、取引、またはその他の種類の助言もしくは推奨であることを意図したものではなく、またこれらに該当するものでもありません。詳細は利用規約をご覧ください。
オープンソーススクリプト
TradingViewの精神に則り、このスクリプトの作者はコードをオープンソースとして公開してくれました。トレーダーが内容を確認・検証できるようにという配慮です。作者に拍手を送りましょう!無料で利用できますが、コードの再公開はハウスルールに従う必要があります。
免責事項
これらの情報および投稿は、TradingViewが提供または承認する金融、投資、取引、またはその他の種類の助言もしくは推奨であることを意図したものではなく、またこれらに該当するものでもありません。詳細は利用規約をご覧ください。