アップデート済
Percent Gainer - Swing HTF S/R
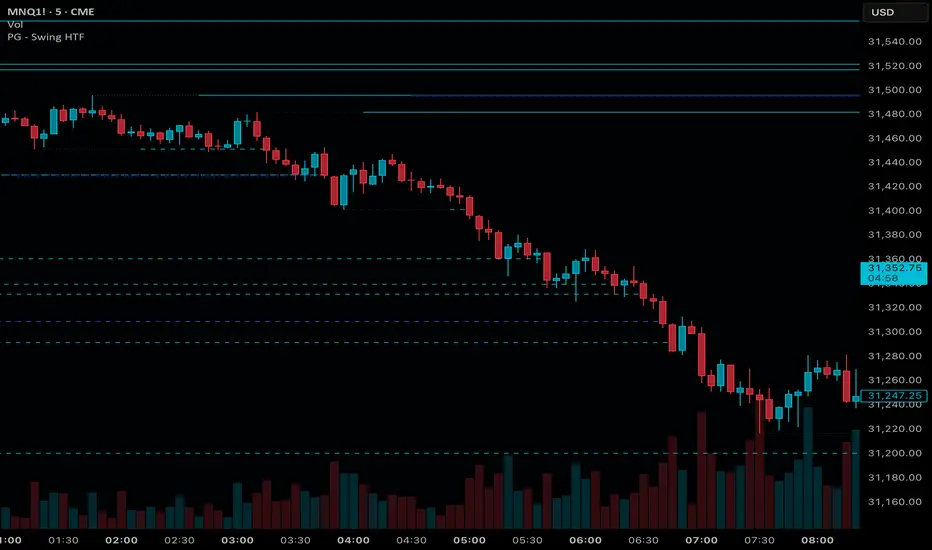
Most multi-timeframe swing S/R tools draw each level from the swing candle, which makes it look like the level existed before it could have been known. Percent Gainer - Swing HTF S/R shows the real timeline: a faint line marks where the swing formed, and a solid line starts only once the swing is confirmed on its own timeframe. Levels from up to five timeframes are non-repainting and always calculated from standard OHLC, even on Heikin Ashi charts.
HOW IT WORKS
For each enabled timeframe, the script finds pivot highs and pivot lows using a Strength setting (the number of bars on each side of the pivot on that timeframe). Each level is offset by a small ATR buffer (ATR Length x ATR Multiple, measured on the pivot's own timeframe) to place the level just beyond the swing extreme.
A swing is only confirmed once Strength bars have closed after it on that timeframe. The script draws this in two parts:
- Faint dotted line: from the swing bar to the confirmation bar. This marks where the swing formed, but the level was not yet known during this period.
- Confirmed line: starts on the first bar after confirmation and extends right until price closes through it, then stops.
Swing highs use solid lines. Swing lows use the line style you choose (dashed by default). The most recent active level for each timeframe is also shown on the price scale.
NON-REPAINTING
Higher-timeframe data is taken only from closed bars of that timeframe. A level never appears from a developing 4H, 1H or 15m bar, so what you see in history is what you would have seen live.
STANDARD CANDLES ONLY
All calculations, including level breaks, use standard OHLC data regardless of chart type. On Heikin Ashi or other non-standard charts, the levels match a regular candlestick chart.
TIMEFRAMES (defaults)
- TF1: 4H (orange)
- TF2: 1H (yellow)
- TF3: 15m (blue)
- TF4: 5m (aqua)
- TF5: chart timeframe (red, off by default)
Each timeframe can be enabled, re-timed and recolored independently.
LOWER TIMEFRAMES ARE NOT SHOWN ON HIGHER TIMEFRAME CHARTS
Levels are only drawn from timeframes equal to or higher than the chart timeframe. Any timeframe lower than the chart is skipped automatically, because lower-timeframe data cannot be requested reliably on a higher-timeframe chart. Examples:
- On a 5m chart: 4H, 1H, 15m and 5m levels are all shown.
- On a 15m chart: 4H, 1H and 15m levels are shown; 5m is hidden.
- On a 1H chart: 4H and 1H levels are shown; 15m and 5m are hidden.
- Above 4H: only the Chart TF levels (TF5) can be shown, if enabled.
SETTINGS
- Confirmed Line Width, Line Style for Swing Lows
- Show Pre-Confirmation Line and its transparency
- Swing High / Swing Low Source (High, Low, Close, HL2, etc.)
- Per timeframe: SH Strength, SL Strength, Color, ATR Length, ATR Multiple
HOW TO USE
Use the higher-timeframe levels as reference zones for reactions, breakouts and targets on a lower-timeframe chart. A level stays active until a close beyond it; broken levels remain on the chart where they ended for context. Higher Strength values produce fewer, more significant swings with a longer confirmation delay.
NOTES
- The pre-confirmation line starts at the open of the higher-timeframe bar containing the swing, not at the exact lower-timeframe candle of the extreme.
- This is a charting tool. It does not generate signals and makes no performance claims.
HOW IT WORKS
For each enabled timeframe, the script finds pivot highs and pivot lows using a Strength setting (the number of bars on each side of the pivot on that timeframe). Each level is offset by a small ATR buffer (ATR Length x ATR Multiple, measured on the pivot's own timeframe) to place the level just beyond the swing extreme.
A swing is only confirmed once Strength bars have closed after it on that timeframe. The script draws this in two parts:
- Faint dotted line: from the swing bar to the confirmation bar. This marks where the swing formed, but the level was not yet known during this period.
- Confirmed line: starts on the first bar after confirmation and extends right until price closes through it, then stops.
Swing highs use solid lines. Swing lows use the line style you choose (dashed by default). The most recent active level for each timeframe is also shown on the price scale.
NON-REPAINTING
Higher-timeframe data is taken only from closed bars of that timeframe. A level never appears from a developing 4H, 1H or 15m bar, so what you see in history is what you would have seen live.
STANDARD CANDLES ONLY
All calculations, including level breaks, use standard OHLC data regardless of chart type. On Heikin Ashi or other non-standard charts, the levels match a regular candlestick chart.
TIMEFRAMES (defaults)
- TF1: 4H (orange)
- TF2: 1H (yellow)
- TF3: 15m (blue)
- TF4: 5m (aqua)
- TF5: chart timeframe (red, off by default)
Each timeframe can be enabled, re-timed and recolored independently.
LOWER TIMEFRAMES ARE NOT SHOWN ON HIGHER TIMEFRAME CHARTS
Levels are only drawn from timeframes equal to or higher than the chart timeframe. Any timeframe lower than the chart is skipped automatically, because lower-timeframe data cannot be requested reliably on a higher-timeframe chart. Examples:
- On a 5m chart: 4H, 1H, 15m and 5m levels are all shown.
- On a 15m chart: 4H, 1H and 15m levels are shown; 5m is hidden.
- On a 1H chart: 4H and 1H levels are shown; 15m and 5m are hidden.
- Above 4H: only the Chart TF levels (TF5) can be shown, if enabled.
SETTINGS
- Confirmed Line Width, Line Style for Swing Lows
- Show Pre-Confirmation Line and its transparency
- Swing High / Swing Low Source (High, Low, Close, HL2, etc.)
- Per timeframe: SH Strength, SL Strength, Color, ATR Length, ATR Multiple
HOW TO USE
Use the higher-timeframe levels as reference zones for reactions, breakouts and targets on a lower-timeframe chart. A level stays active until a close beyond it; broken levels remain on the chart where they ended for context. Higher Strength values produce fewer, more significant swings with a longer confirmation delay.
NOTES
- The pre-confirmation line starts at the open of the higher-timeframe bar containing the swing, not at the exact lower-timeframe candle of the extreme.
- This is a charting tool. It does not generate signals and makes no performance claims.
リリースノート
Updated defaults for the ATR multiple to 0
免責事項
これらの情報および投稿は、TradingViewが提供または承認する金融、投資、取引、またはその他の種類の助言もしくは推奨であることを意図したものではなく、またこれらに該当するものでもありません。詳細は利用規約をご覧ください。
免責事項
これらの情報および投稿は、TradingViewが提供または承認する金融、投資、取引、またはその他の種類の助言もしくは推奨であることを意図したものではなく、またこれらに該当するものでもありません。詳細は利用規約をご覧ください。