OPEN-SOURCE SCRIPT
Sessions + [Interakktive]
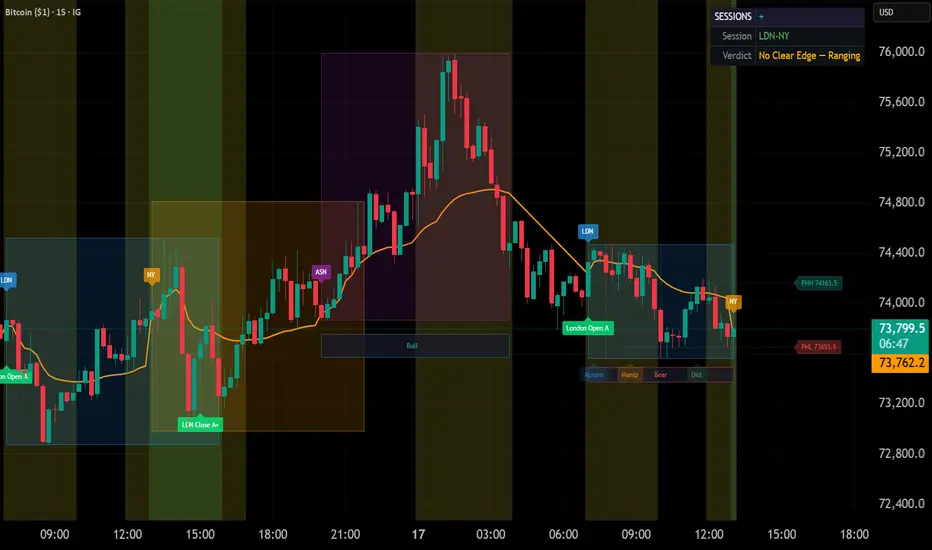
Sessions + is a multi-layer session intelligence indicator that maps the trading day's structure across three analytical layers: institutional levels, ICT concepts, and real-time analytics. It combines session detection, a full hierarchy of reference levels from hourly to quarterly, killzone effectiveness grading, Power of 3 phase detection, CBDR expansion targets, a live VWAP-based DNA predictor, anomaly monitoring, and an adaptive plain-English dashboard into a single overlay.
The indicator works across all asset classes — crypto, forex, stocks, indices, and commodities — with automatic asset class detection that adjusts which sessions and analytics are relevant. On intraday timeframes it provides full session intelligence. On daily, weekly, and monthly charts it automatically pivots to showing institutional reference levels and an adaptive dashboard that tells you where price sits relative to yesterday, the weekly range, and the monthly structure. No competitor session indicator adapts across timeframes like this.
Sessions + is a context tool, not a signal generator. It does not issue buy or sell signals. It answers the question every session trader asks before placing a trade: "Where am I in the trading day, and is this session worth trading?" Like all technical analysis, it works best when combined with proper risk management and the trader's own judgment.
⚙️ **The Dashboard**
The dashboard synthesizes all active intelligence into a plain-English panel. Every row shows a narrative — not raw numbers. "Strong Bearish — Ranging" instead of "-0.45". "Range Exhausted" instead of "82%". "NY likely bullish" instead of "65% cont".
Six views control density: Off, Minimal (session + verdict), Status (adds killzone grades, timing, bias, ADR, activity), Trade (adds PO3, energy, projections), Analytics (adds DNA, flow, range, efficiency, anomalies), and Full (everything). Each progressive view includes the rows from previous views so context is never lost.
The verdict row combines directional bias with regime classification into a single answer: "Leaning Bullish — Trending", "No Clear Edge — Ranging", "Strong Bearish — Volatile". One glance, one decision.

*Dashboard in Full mode on BTCUSD 15m: plain-English intelligence across every row — verdict with regime, killzone grades (LDN:A, LC:A), PO3 phase, DNA live read, inter-session flow, anomaly detection with warning. Session boxes and VWAP provide chart context behind the panel.*
⚙️ **Levels Layer — Institutional Reference Lines**
Sessions + provides a complete hierarchy of institutional reference levels, each with visual weight that scales with timeframe importance:
Previous Hour High/Low (PHH/PHL) — dotted micro-levels for intraday scalping. Previous Day High/Low/Close (PDH/PDL/PDC) — the daily framework that institutional traders watch for liquidity grabs. Previous Week High/Low (PWH/PWL) — swing-level institutional references where weekly liquidity rests. Previous Month and Quarter High/Low (PMH/PML/PQH/PQL) — the heavyweight levels where hedge funds and central banks operate.
Additional level features include: ADR Projection Levels (expected daily high/low from the midnight open), Opening Range (the first N minutes' range as a breakout reference with a clearly filled box), Session VWAP (institutional volume-weighted benchmark per session), and Session Equilibrium (the 50% midpoint of each session's range — a magnet for retracements). Every level label includes a tooltip explaining why it matters and how to use it.

*Levels Layer on BTCUSD 15m: institutional levels from hourly through weekly — PDH, PDC, PWH (heavier line weight), ADR High/Low projections, Session Equilibrium (dashed), Opening Range, and VWAP line. Labels on the right edge show level names and prices. Visual weight increases with timeframe importance.*
⚙️ **ICT Layer — Killzones, Power of 3, and CBDR**
The ICT Layer implements key Inner Circle Trader concepts with intelligence features that go beyond static time boxes.
Killzones highlight four high-probability time windows (Asian, London Open, NY AM, London Close) with individual toggles and configurable times. Each killzone is graded A+ through D based on its historical reversal success rate and move quality on the specific instrument — a feature not found in other session indicators. Grades update as data accumulates, helping traders focus on the killzones that actually work for the asset they are trading.
Power of 3 Detection divides the selected session into three institutional phases — Accumulation (range building), Manipulation (false break), and Distribution (true directional move). Rather than floating labels above candles, the phases are shown as zones inside the session box with vertical dividers and phase names at the bottom, creating a clear visual narrative of how the session developed.
CBDR Projections (Central Bank Dealers Range) calculate the range formed during 20:00–00:00 UTC and project 1x and 2x expansion targets above and below. The 2x target is drawn with heavier line weight — this is where the real daily move often reaches.
Additional ICT features include Silver Bullet windows (AM and PM reversal windows), Macro Times (5-minute reversal windows at key NY times), Midnight Open (00:00 UTC true day open), and Weekly Open (Monday's opening price as a bias reference).

*ICT Layer on EURUSD 15m: CBDR expansion targets (cyan lines — 1x dashed, 2x solid), killzone backgrounds with effectiveness grades (London Open A, London Close C), Silver Bullet window (green), Midnight Open reference line, and PO3 Distribution label. Dashboard in Status view shows KZ Grades and Silver Bullet Grades.*
⚙️ **Analytics Layer — Session DNA, Flow, and Anomaly Detection**
The Analytics Layer provides intelligence features that help traders evaluate session quality in real time.
Session DNA is a live VWAP-based predictor that tracks where price sits relative to the session's Volume-Weighted Average Price. Each session gets a narrative box below it that builds as the session develops: "Bull" means price has stayed above VWAP, "Bear - Bull" means it started bearish then flipped bullish, "Bear - Neutral - Bull" tells a choppy reversal story. The narrative uses a 5-bar confirmation filter and caps at 4 entries to prevent noise. Previous session DNA can be toggled on to see the historical track record.
Inter-Session Flow tracks whether London tends to continue or reverse Asian's direction, and whether NY follows London. The dashboard shows this as a plain-English prediction: "NY likely bullish" or "NY may reverse" — combining the historical continuation rate with the current session's actual direction.
Anomaly Detection monitors six types of unusual conditions in real time: range anomalies (session range far from normal), volatility spikes, timing anomalies (high/low at unusual phases), inter-session gaps, flow contradictions (direction against history), and ADR consumption rate. When anomalies fire, chart markers appear with tooltips explaining what to expect and how to adjust risk management.
Additional analytics include Session Score (a 0-100 energy rating answering "is this session worth trading?"), Regime Detection (classifying the market as Trending, Ranging, Volatile, or Dead — merged into the dashboard verdict), and Efficiency tracking.

*Analytics Layer on XAUUSD 15m: Session DNA narrative boxes below each session — "Bear - Bull" shows the Asian session started bearish then flipped bullish, "Bear" shows the current London session is bearish. Dashboard in Analytics view shows DNA (Live), Flow prediction ("NY likely bearish"), Range ("Compressed"), Efficiency ("Choppy"), and Anomaly status.*
⚙️ **Multi-Timeframe Adaptivity**
Sessions + automatically adapts its behavior based on the chart timeframe. This is not a feature you toggle — it happens intelligently.
On sub-hourly timeframes (1m through 45m): full session experience with boxes, labels, DNA, killzones, all levels, and the complete dashboard.
On hourly timeframes (1H through 4H): session boxes remain but session labels are suppressed to prevent clutter. Killzones and sub-hourly features are disabled. The dashboard shows session context without granular details.
On daily and higher timeframes: session boxes are completely hidden. The indicator pivots to institutional reference levels — PDH/PDL, PWH/PWL, PMH/PML, PQH/PQL, and ADR projections. The dashboard adapts its rows to show higher-timeframe context: "Below Yesterday's Close", "Near Weekly High", "Mid Monthly Range". This means traders can keep Sessions + on their chart across all timeframes without it breaking or showing meaningless data.

*Daily chart on BTCUSD: Sessions + automatically shows institutional levels only — PMH (79356), PML (60072, red), PDH/PDC (dashed), ADR High/Low projections. No session boxes, no intraday clutter. Dashboard shows higher-timeframe context: Verdict "Ranging", vs Yesterday, Weekly position, Monthly position, and ADR status.*
⚙️ **Alert System**
Sessions + provides 39 alert conditions through TradingView's built-in alert system. All conditions are always active — traders choose which to enable through TradingView's alert dialog. Conditions include: session start/end events, killzone activations, ADR exhaustion, anomaly detection, regime changes, PO3 phase transitions, Silver Bullet window events, and more.
⚙️ **Settings and Customization**
The indicator has approximately 70 configurable inputs organized into clear groups: Main Settings (asset class, history, lookback), Session Config (times, box style, early/extended detection), Levels Layer (each level type individually toggleable), ICT Layer (each concept independently controlled with individual killzone toggles), Analytics Layer (DNA, regime, flow, score, anomaly), Display (dashboard view, position, size, labels), and Colors (every element customizable). Every non-color input includes a tooltip explaining what it does and why it matters.
⚠️ **Limitations and Honest Caveats**
Sessions + is a technical analysis tool with inherent limitations:
No indicator predicts the future. Session DNA, flow analysis, and regime detection are based on historical patterns and VWAP positioning — they provide probabilistic context, not certainty. Past session behavior does not guarantee future performance. The indicator is designed for intraday and swing trading on liquid markets. On illiquid instruments or during holidays, session behavior may be abnormal and analytics less reliable. Killzone effectiveness grades need sufficient historical data to stabilize — expect "Building data..." for the first several sessions. Anomaly detection sensitivity affects how many markers appear — higher sensitivity means more alerts, some of which may be noise. Session times use forex convention by default (UTC-based). Stock traders should note that the Asian session box covers Tokyo hours, not US pre-market. ADR projections assume symmetric distribution from the midnight open, which is a simplification — markets often have directional bias. The indicator uses 7 request.security calls (well within limits) but traders running multiple multi-timeframe indicators should be aware of potential resource constraints.
⚠️ **Risk Disclaimer**
All content, tools, scripts, and educational material provided are purely for informational and educational purposes. This indicator does not constitute financial, investment, or trading advice. Trading involves substantial risk of loss. Past performance and historical analysis do not guarantee future results. Users are solely responsible for their own trading decisions. Always conduct your own due diligence and consult a qualified financial advisor before making investment decisions.
The indicator works across all asset classes — crypto, forex, stocks, indices, and commodities — with automatic asset class detection that adjusts which sessions and analytics are relevant. On intraday timeframes it provides full session intelligence. On daily, weekly, and monthly charts it automatically pivots to showing institutional reference levels and an adaptive dashboard that tells you where price sits relative to yesterday, the weekly range, and the monthly structure. No competitor session indicator adapts across timeframes like this.
Sessions + is a context tool, not a signal generator. It does not issue buy or sell signals. It answers the question every session trader asks before placing a trade: "Where am I in the trading day, and is this session worth trading?" Like all technical analysis, it works best when combined with proper risk management and the trader's own judgment.
⚙️ **The Dashboard**
The dashboard synthesizes all active intelligence into a plain-English panel. Every row shows a narrative — not raw numbers. "Strong Bearish — Ranging" instead of "-0.45". "Range Exhausted" instead of "82%". "NY likely bullish" instead of "65% cont".
Six views control density: Off, Minimal (session + verdict), Status (adds killzone grades, timing, bias, ADR, activity), Trade (adds PO3, energy, projections), Analytics (adds DNA, flow, range, efficiency, anomalies), and Full (everything). Each progressive view includes the rows from previous views so context is never lost.
The verdict row combines directional bias with regime classification into a single answer: "Leaning Bullish — Trending", "No Clear Edge — Ranging", "Strong Bearish — Volatile". One glance, one decision.
*Dashboard in Full mode on BTCUSD 15m: plain-English intelligence across every row — verdict with regime, killzone grades (LDN:A, LC:A), PO3 phase, DNA live read, inter-session flow, anomaly detection with warning. Session boxes and VWAP provide chart context behind the panel.*
⚙️ **Levels Layer — Institutional Reference Lines**
Sessions + provides a complete hierarchy of institutional reference levels, each with visual weight that scales with timeframe importance:
Previous Hour High/Low (PHH/PHL) — dotted micro-levels for intraday scalping. Previous Day High/Low/Close (PDH/PDL/PDC) — the daily framework that institutional traders watch for liquidity grabs. Previous Week High/Low (PWH/PWL) — swing-level institutional references where weekly liquidity rests. Previous Month and Quarter High/Low (PMH/PML/PQH/PQL) — the heavyweight levels where hedge funds and central banks operate.
Additional level features include: ADR Projection Levels (expected daily high/low from the midnight open), Opening Range (the first N minutes' range as a breakout reference with a clearly filled box), Session VWAP (institutional volume-weighted benchmark per session), and Session Equilibrium (the 50% midpoint of each session's range — a magnet for retracements). Every level label includes a tooltip explaining why it matters and how to use it.
*Levels Layer on BTCUSD 15m: institutional levels from hourly through weekly — PDH, PDC, PWH (heavier line weight), ADR High/Low projections, Session Equilibrium (dashed), Opening Range, and VWAP line. Labels on the right edge show level names and prices. Visual weight increases with timeframe importance.*
⚙️ **ICT Layer — Killzones, Power of 3, and CBDR**
The ICT Layer implements key Inner Circle Trader concepts with intelligence features that go beyond static time boxes.
Killzones highlight four high-probability time windows (Asian, London Open, NY AM, London Close) with individual toggles and configurable times. Each killzone is graded A+ through D based on its historical reversal success rate and move quality on the specific instrument — a feature not found in other session indicators. Grades update as data accumulates, helping traders focus on the killzones that actually work for the asset they are trading.
Power of 3 Detection divides the selected session into three institutional phases — Accumulation (range building), Manipulation (false break), and Distribution (true directional move). Rather than floating labels above candles, the phases are shown as zones inside the session box with vertical dividers and phase names at the bottom, creating a clear visual narrative of how the session developed.
CBDR Projections (Central Bank Dealers Range) calculate the range formed during 20:00–00:00 UTC and project 1x and 2x expansion targets above and below. The 2x target is drawn with heavier line weight — this is where the real daily move often reaches.
Additional ICT features include Silver Bullet windows (AM and PM reversal windows), Macro Times (5-minute reversal windows at key NY times), Midnight Open (00:00 UTC true day open), and Weekly Open (Monday's opening price as a bias reference).
*ICT Layer on EURUSD 15m: CBDR expansion targets (cyan lines — 1x dashed, 2x solid), killzone backgrounds with effectiveness grades (London Open A, London Close C), Silver Bullet window (green), Midnight Open reference line, and PO3 Distribution label. Dashboard in Status view shows KZ Grades and Silver Bullet Grades.*
⚙️ **Analytics Layer — Session DNA, Flow, and Anomaly Detection**
The Analytics Layer provides intelligence features that help traders evaluate session quality in real time.
Session DNA is a live VWAP-based predictor that tracks where price sits relative to the session's Volume-Weighted Average Price. Each session gets a narrative box below it that builds as the session develops: "Bull" means price has stayed above VWAP, "Bear - Bull" means it started bearish then flipped bullish, "Bear - Neutral - Bull" tells a choppy reversal story. The narrative uses a 5-bar confirmation filter and caps at 4 entries to prevent noise. Previous session DNA can be toggled on to see the historical track record.
Inter-Session Flow tracks whether London tends to continue or reverse Asian's direction, and whether NY follows London. The dashboard shows this as a plain-English prediction: "NY likely bullish" or "NY may reverse" — combining the historical continuation rate with the current session's actual direction.
Anomaly Detection monitors six types of unusual conditions in real time: range anomalies (session range far from normal), volatility spikes, timing anomalies (high/low at unusual phases), inter-session gaps, flow contradictions (direction against history), and ADR consumption rate. When anomalies fire, chart markers appear with tooltips explaining what to expect and how to adjust risk management.
Additional analytics include Session Score (a 0-100 energy rating answering "is this session worth trading?"), Regime Detection (classifying the market as Trending, Ranging, Volatile, or Dead — merged into the dashboard verdict), and Efficiency tracking.
*Analytics Layer on XAUUSD 15m: Session DNA narrative boxes below each session — "Bear - Bull" shows the Asian session started bearish then flipped bullish, "Bear" shows the current London session is bearish. Dashboard in Analytics view shows DNA (Live), Flow prediction ("NY likely bearish"), Range ("Compressed"), Efficiency ("Choppy"), and Anomaly status.*
⚙️ **Multi-Timeframe Adaptivity**
Sessions + automatically adapts its behavior based on the chart timeframe. This is not a feature you toggle — it happens intelligently.
On sub-hourly timeframes (1m through 45m): full session experience with boxes, labels, DNA, killzones, all levels, and the complete dashboard.
On hourly timeframes (1H through 4H): session boxes remain but session labels are suppressed to prevent clutter. Killzones and sub-hourly features are disabled. The dashboard shows session context without granular details.
On daily and higher timeframes: session boxes are completely hidden. The indicator pivots to institutional reference levels — PDH/PDL, PWH/PWL, PMH/PML, PQH/PQL, and ADR projections. The dashboard adapts its rows to show higher-timeframe context: "Below Yesterday's Close", "Near Weekly High", "Mid Monthly Range". This means traders can keep Sessions + on their chart across all timeframes without it breaking or showing meaningless data.
*Daily chart on BTCUSD: Sessions + automatically shows institutional levels only — PMH (79356), PML (60072, red), PDH/PDC (dashed), ADR High/Low projections. No session boxes, no intraday clutter. Dashboard shows higher-timeframe context: Verdict "Ranging", vs Yesterday, Weekly position, Monthly position, and ADR status.*
⚙️ **Alert System**
Sessions + provides 39 alert conditions through TradingView's built-in alert system. All conditions are always active — traders choose which to enable through TradingView's alert dialog. Conditions include: session start/end events, killzone activations, ADR exhaustion, anomaly detection, regime changes, PO3 phase transitions, Silver Bullet window events, and more.
⚙️ **Settings and Customization**
The indicator has approximately 70 configurable inputs organized into clear groups: Main Settings (asset class, history, lookback), Session Config (times, box style, early/extended detection), Levels Layer (each level type individually toggleable), ICT Layer (each concept independently controlled with individual killzone toggles), Analytics Layer (DNA, regime, flow, score, anomaly), Display (dashboard view, position, size, labels), and Colors (every element customizable). Every non-color input includes a tooltip explaining what it does and why it matters.
⚠️ **Limitations and Honest Caveats**
Sessions + is a technical analysis tool with inherent limitations:
No indicator predicts the future. Session DNA, flow analysis, and regime detection are based on historical patterns and VWAP positioning — they provide probabilistic context, not certainty. Past session behavior does not guarantee future performance. The indicator is designed for intraday and swing trading on liquid markets. On illiquid instruments or during holidays, session behavior may be abnormal and analytics less reliable. Killzone effectiveness grades need sufficient historical data to stabilize — expect "Building data..." for the first several sessions. Anomaly detection sensitivity affects how many markers appear — higher sensitivity means more alerts, some of which may be noise. Session times use forex convention by default (UTC-based). Stock traders should note that the Asian session box covers Tokyo hours, not US pre-market. ADR projections assume symmetric distribution from the midnight open, which is a simplification — markets often have directional bias. The indicator uses 7 request.security calls (well within limits) but traders running multiple multi-timeframe indicators should be aware of potential resource constraints.
⚠️ **Risk Disclaimer**
All content, tools, scripts, and educational material provided are purely for informational and educational purposes. This indicator does not constitute financial, investment, or trading advice. Trading involves substantial risk of loss. Past performance and historical analysis do not guarantee future results. Users are solely responsible for their own trading decisions. Always conduct your own due diligence and consult a qualified financial advisor before making investment decisions.
オープンソーススクリプト
TradingViewの精神に則り、このスクリプトの作者はコードをオープンソースとして公開してくれました。トレーダーが内容を確認・検証できるようにという配慮です。作者に拍手を送りましょう!無料で利用できますが、コードの再公開はハウスルールに従う必要があります。

Interakktive — Next-Generation Trading Intelligence
Precision Structure • Institutional Logic • Zero Noise
🌐 interakktive.com
📩 interakktive@gmail.com
Precision Structure • Institutional Logic • Zero Noise
🌐 interakktive.com
📩 interakktive@gmail.com
免責事項
これらの情報および投稿は、TradingViewが提供または承認する金融、投資、取引、またはその他の種類の助言もしくは推奨であることを意図したものではなく、またこれらに該当するものでもありません。詳細は利用規約をご覧ください。
オープンソーススクリプト
TradingViewの精神に則り、このスクリプトの作者はコードをオープンソースとして公開してくれました。トレーダーが内容を確認・検証できるようにという配慮です。作者に拍手を送りましょう!無料で利用できますが、コードの再公開はハウスルールに従う必要があります。
Interakktive — Next-Generation Trading Intelligence
Precision Structure • Institutional Logic • Zero Noise
🌐 interakktive.com
📩 interakktive@gmail.com
Precision Structure • Institutional Logic • Zero Noise
🌐 interakktive.com
📩 interakktive@gmail.com
免責事項
これらの情報および投稿は、TradingViewが提供または承認する金融、投資、取引、またはその他の種類の助言もしくは推奨であることを意図したものではなく、またこれらに該当するものでもありません。詳細は利用規約をご覧ください。