アップデート済
Previous Day & Week OHLC
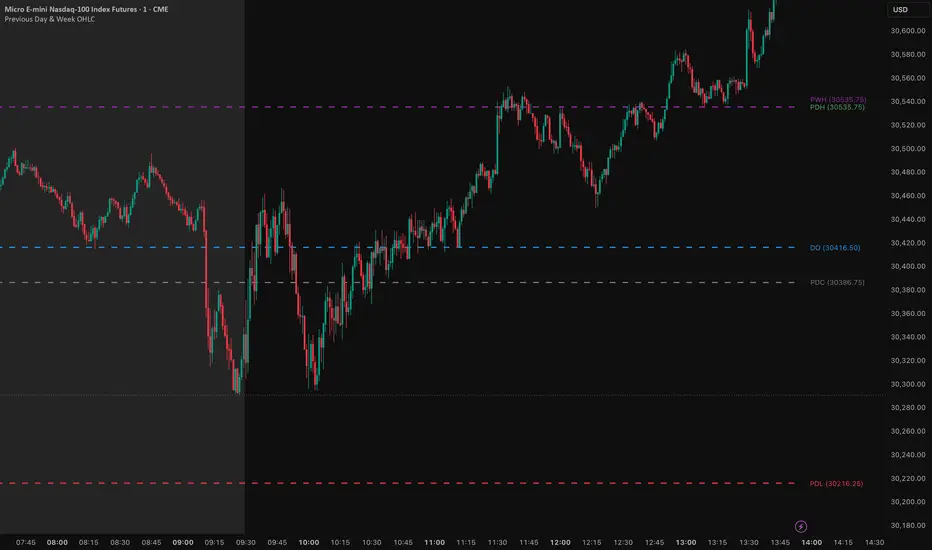
This indicator automatically plots key daily and weekly reference levels on your chart, helping traders identify potential support, resistance, liquidity zones and breakout areas.
Plotted Levels
Features
Plotted Levels
- PDH - Previous Day High
- PDL – Previous Day Low
- PDC – Previous Day Close
- DO – Current Day Open
- PWH – Previous Week High
- PWL – Previous Week Low
Features
- Automatic Daily & Weekly Level Plotting - Levels update automatically as new sessions begin.
- Smart Label Overlap Protection - When multiple levels share the same price, labels are automatically offset to prevent overlapping while maintaining readability.
- Preserved Color Identification - Each level retains its individual color, making it easy to distinguish between daily and weekly references.
- Historical Levels Option - Display only the current session's levels or keep previous levels visible for historical analysis and backtesting.
- Fully Customizable Appearance - Adjust colors, line styles, line widths, label sizes and label positions to match your preferred chart layout.
リリースノート
Optimized runtime performance by updating active lines and labels only when needed. Historical levels are finalized at each session boundary.リリースノート
Improved initial loading performance when switching chart timeframes. With historical levels disabled, the script now draws only the current session’s levels. Historical levels remain available when enabled.
免責事項
これらの情報および投稿は、TradingViewが提供または承認する金融、投資、取引、またはその他の種類の助言もしくは推奨であることを意図したものではなく、またこれらに該当するものでもありません。詳細は利用規約をご覧ください。
免責事項
これらの情報および投稿は、TradingViewが提供または承認する金融、投資、取引、またはその他の種類の助言もしくは推奨であることを意図したものではなく、またこれらに該当するものでもありません。詳細は利用規約をご覧ください。