ICT Pullback Setup | Smart OTE Fibonacci Levels [RadixAlgo]
🔶About the Indicator
A strong price move rarely travels in a perfectly straight line. Markets expand, create directional displacement, reach temporary extremes, and then retrace before deciding whether the original move still has enough strength to continue. For traders using ICT concepts, Smart Money Concepts, Fibonacci retracement, OTE trading, and price action, this pullback phase is often where the most useful information appears.

The challenge is not simply drawing a Fibonacci retracement between two visible points. The more difficult part is identifying which swing actually represents the active move, where the impulse begins, how far the displacement has extended, and whether the current retracement still belongs to the same market structure.
ICT Pullback Setup | Smart OTE Fibonacci Levels [RadixAlgo] was built to simplify this process. Instead of relying on a static Fibonacci tool drawn manually between two swing points, the indicator analyzes directional price movement, identifies the active origin and destination, and creates an adaptive Fibonacci retracement structure around the developing impulse.
As the market continues expanding, the destination can update with new highs or lows. This keeps the Fibonacci retracement levels and selected OTE entry aligned with the latest extension of the move rather than leaving the setup anchored to an older swing that may no longer represent current price action.
The indicator combines displacement analysis, Fibonacci retracement, pullback detection, ATR-based stop-loss placement, and reward-to-risk visualization in one chart-based framework. Bullish and bearish setups are treated separately, allowing traders to follow the complete sequence from the initial impulse to the retracement, entry area, stop-loss, and potential target.
This is not simply a Fibonacci drawing tool. It is designed to give traders more context around ICT pullbacks, Optimal Trade Entry zones, Smart Money price action, market structure, trend continuation, and retracement behavior while keeping the entire setup visible directly on the chart.
🔶How It Works
The indicator begins by identifying the market structure behind a potential pullback. Confirmed pivot highs and pivot lows are treated as possible origins for directional movement, but a pivot alone is not enough to activate a setup. The script evaluates how far price moves away from the structural point relative to ATR and the number of candles involved, helping distinguish meaningful directional displacement from smaller or slower price fluctuations.
Once sufficient displacement is detected, the indicator defines an origin and a destination for the active impulse. The origin represents the structural point from which the move develops, while the destination represents the furthest price reached in the direction of that movement. The destination remains dynamic and can continue updating as price creates new highs or lows.
This allows the Fibonacci retracement and selected entry level to remain connected to the latest extension of the active move rather than an earlier swing. Once the origin and destination are established, the indicator calculates the main Fibonacci retracement levels, including 23.6%, 38.2%, 50.0%, 61.8%, and 78.6%. Traders can select one of these levels as the active entry, ranging from shallower retracements to deeper OTE-style pullback zones.
🔹Bullish Pullback Setup
A bullish setup begins from a confirmed structural low. The indicator monitors the upward movement developing from that point and waits for sufficient displacement relative to ATR and the number of candles involved. Once the condition is satisfied, the structural low becomes the bullish origin and the highest price reached during the move becomes the destination.

If the bullish impulse continues creating new highs, the destination updates automatically. The Fibonacci retracement and selected entry level are recalculated with each new extension, keeping the setup aligned with the developing bullish move rather than an earlier high.

The entry becomes relevant when price retraces to the selected Fibonacci level. Instead of entering during the initial upward displacement, the setup waits for price to return into the active impulse. A shallower Fibonacci level requires a smaller pullback, while levels such as 61.8% or 78.6% require price to retrace deeper toward the bullish origin.

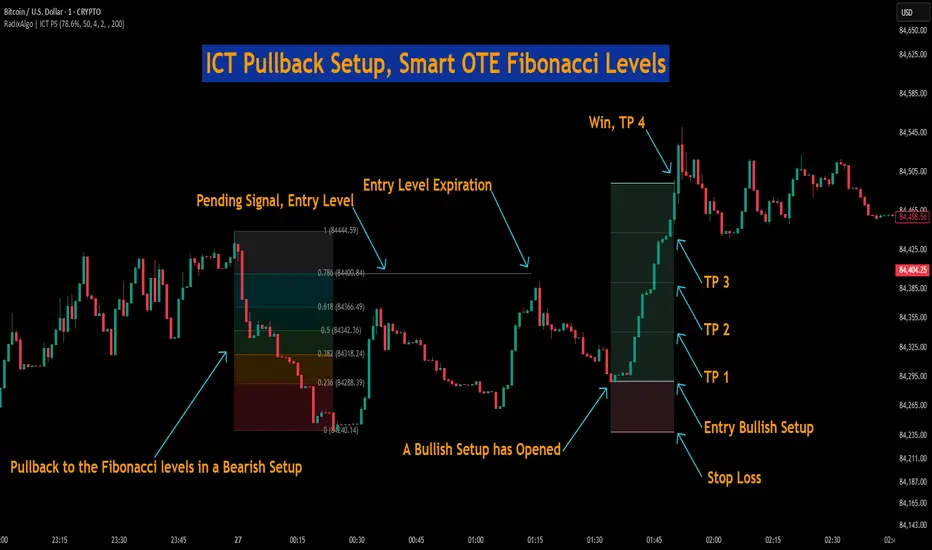
Once the bullish entry is triggered, the stop-loss is positioned below the structural origin with an ATR-based buffer. The distance between the entry and stop-loss defines the initial risk, which is then used to calculate the reward levels above the entry.
🔹Bearish Pullback Setup
A bearish setup follows the same process in the opposite direction. It begins from a confirmed structural high, and the indicator monitors the downside movement developing from that point. Once sufficient bearish displacement is detected, the structural high becomes the bearish origin and the lowest price reached during the move becomes the destination.

If price continues creating lower lows, the destination updates automatically. The Fibonacci retracement and selected entry level are recalculated with each extension, allowing the setup to remain aligned with the latest bearish expansion.

The entry becomes relevant when price retraces upward to the selected Fibonacci level. A shallow retracement reaches the entry earlier, while a deeper level requires price to move further back toward the bearish origin before the setup is triggered.

Once the bearish entry is triggered, the stop-loss is positioned above the structural origin with an ATR-based buffer. The distance between the entry and stop-loss defines the initial risk, and the reward levels are then projected below the entry according to the selected Reward / Risk setting.
🔹Pending Entry & Intrabar Resolution
Once a valid bullish or bearish setup becomes active, the selected Fibonacci level is treated as a pending entry. If the impulse extends again before price reaches that level, the destination changes and the Fibonacci entry is recalculated automatically. The pending entry therefore continues adapting to the active price move until it is triggered or reaches its expiration limit.
Historical candles can create an additional challenge when the same candle both extends the destination and touches a Fibonacci entry. A standard OHLC candle cannot always reveal whether the extension occurred before or after the retracement.
When the optional historical intrabar check is enabled, the indicator uses lower-timeframe data to inspect this sequence in greater detail. It can evaluate whether the previous entry was reached first, whether the destination extended before the retracement, or whether the newly calculated entry was reached after that extension.
This provides a more detailed reconstruction of historical entries than relying only on the high and low of the chart candle, particularly when extension and retracement occur within the same bar.
🔹Risk & Reward Management
After an entry is triggered, the indicator creates a reward-to-risk structure directly on the chart. The entry becomes the central reference point, while the structural stop-loss defines the initial risk distance.
Each reward level is calculated from that same risk distance. With a Reward / Risk setting of 2, for example, the indicator displays an intermediate 1R level and a final 2R target. Bullish reward levels are projected above the entry, while bearish reward levels are projected below it.
The indicator continues monitoring the active R/R structure after entry. A position can reach the stop-loss, reach the take-profit, expire after the maximum number of position bars, or close because of an opposite entry when that option is enabled. When historical price data cannot reliably determine the sequence between stop-loss and target events, the result can also be classified as Ambiguous.
The Fibonacci structure is intended to organize the relationship between displacement, retracement, entry, invalidation, and reward. The selected retracement depth defines where the pullback entry is placed, while broader price action and market context can be used separately when evaluating the significance of the setup.
🔶Input Parameters
🔹Entry Fibonacci Level
Selects the Fibonacci retracement level used as the active pullback entry. Available options are 23.6%, 38.2%, 50.0%, 61.8%, and 78.6%. Lower levels create shallower entry areas, while higher values require price to retrace deeper into the original displacement before the entry is triggered.
🔹Entry Expiration Bars
Defines how long the pending Fibonacci entry remains active after the latest extension of the move. If price does not reach the selected entry within the specified number of bars, the pending entry expires.
🔹Reward / Risk
Controls the final reward target relative to the distance between the entry and stop-loss. For example, a value of 2 places the final target at 2R, meaning twice the original risk distance from the entry.
🔹Stop-Loss ATR Threshold
Controls the ATR-based buffer added beyond the structural origin of the setup. Higher values place the stop-loss farther beyond the swing point, while lower values keep the stop closer to the original structure.
🔹Use Intrabar Historical Check
Enables lower-timeframe analysis for historical entry detection. This helps the indicator determine the sequence of events when a candle both extends the destination and reaches a Fibonacci entry level.
🔹Historical Intrabar Timeframe
Selects the lower timeframe used for historical intrabar analysis. Smaller timeframes provide more detailed information about the movement inside each chart candle when sufficient lower-timeframe data is available.
🔹Block New Same-Type Position While Open
Prevents the indicator from activating another position in the same direction while an existing position of that type is still active.
🔹Close Opposite Position On New Entry
Allows a newly triggered entry in the opposite direction to close the currently active position. When disabled, opposite setups can be handled independently according to the existing position logic.
🔹Delete Previous R/R
Controls whether the previous reward-to-risk visualization is removed when a new R/R setup is created. Enabling this option keeps the chart focused on the most recent trade structure.
🔹Position Expiration Bars
Defines the maximum number of bars an active R/R setup can remain unresolved. If neither the stop-loss nor the take-profit is reached during this period, the position is marked as expired.
🔶Summary
ICT Pullback Setup | Smart OTE Fibonacci Levels [RadixAlgo] combines market structure, directional displacement, Fibonacci retracement, OTE-style pullback entries, ATR-based stop-loss placement, and reward-to-risk analysis in one adaptive framework.
Instead of requiring traders to manually select two fixed swing points, the indicator identifies the active origin and destination of the move and continues updating the destination while price expands. This allows the Fibonacci retracement levels to remain connected to the current impulse as market structure develops.
The selected Fibonacci entry gives traders a structured way to monitor shallow or deep pullbacks, while the historical intrabar system helps improve the interpretation of situations where extension and entry occur inside the same candle.
After an entry is triggered, the built-in R/R visualization connects the setup with its structural stop-loss and potential reward levels, allowing traders to follow the entire process from displacement and retracement to entry, risk, and possible continuation.
The indicator can be used alongside ICT concepts, Smart Money Concepts, market structure analysis, liquidity, fair value gaps, order blocks, trend-following strategies, and price action trading. Rather than replacing trader judgment with a rigid signal system, it provides a visual framework for understanding how price moves from impulse to pullback and from pullback toward potential continuation.
⚠️Disclaimer
This indicator is designed for educational and analytical purposes only and should not be considered financial advice or a recommendation to enter any trade. Every signal should be evaluated by the trader based on their own market analysis, strategy, risk tolerance, and trading plan. The decision to use or ignore a signal always remains with the trader.
Not every signal will result in a profitable trade, and losing setups are a normal part of market participation. Historical performance, Fibonacci retracement behavior, OTE-style setups, and reward-to-risk projections do not guarantee future results. Traders should apply appropriate risk management and use the indicator as a supporting analytical tool rather than as an automatic decision-making system.
A strong price move rarely travels in a perfectly straight line. Markets expand, create directional displacement, reach temporary extremes, and then retrace before deciding whether the original move still has enough strength to continue. For traders using ICT concepts, Smart Money Concepts, Fibonacci retracement, OTE trading, and price action, this pullback phase is often where the most useful information appears.
The challenge is not simply drawing a Fibonacci retracement between two visible points. The more difficult part is identifying which swing actually represents the active move, where the impulse begins, how far the displacement has extended, and whether the current retracement still belongs to the same market structure.
ICT Pullback Setup | Smart OTE Fibonacci Levels [RadixAlgo] was built to simplify this process. Instead of relying on a static Fibonacci tool drawn manually between two swing points, the indicator analyzes directional price movement, identifies the active origin and destination, and creates an adaptive Fibonacci retracement structure around the developing impulse.
As the market continues expanding, the destination can update with new highs or lows. This keeps the Fibonacci retracement levels and selected OTE entry aligned with the latest extension of the move rather than leaving the setup anchored to an older swing that may no longer represent current price action.
The indicator combines displacement analysis, Fibonacci retracement, pullback detection, ATR-based stop-loss placement, and reward-to-risk visualization in one chart-based framework. Bullish and bearish setups are treated separately, allowing traders to follow the complete sequence from the initial impulse to the retracement, entry area, stop-loss, and potential target.
This is not simply a Fibonacci drawing tool. It is designed to give traders more context around ICT pullbacks, Optimal Trade Entry zones, Smart Money price action, market structure, trend continuation, and retracement behavior while keeping the entire setup visible directly on the chart.
🔶How It Works
The indicator begins by identifying the market structure behind a potential pullback. Confirmed pivot highs and pivot lows are treated as possible origins for directional movement, but a pivot alone is not enough to activate a setup. The script evaluates how far price moves away from the structural point relative to ATR and the number of candles involved, helping distinguish meaningful directional displacement from smaller or slower price fluctuations.
Once sufficient displacement is detected, the indicator defines an origin and a destination for the active impulse. The origin represents the structural point from which the move develops, while the destination represents the furthest price reached in the direction of that movement. The destination remains dynamic and can continue updating as price creates new highs or lows.
This allows the Fibonacci retracement and selected entry level to remain connected to the latest extension of the active move rather than an earlier swing. Once the origin and destination are established, the indicator calculates the main Fibonacci retracement levels, including 23.6%, 38.2%, 50.0%, 61.8%, and 78.6%. Traders can select one of these levels as the active entry, ranging from shallower retracements to deeper OTE-style pullback zones.
🔹Bullish Pullback Setup
A bullish setup begins from a confirmed structural low. The indicator monitors the upward movement developing from that point and waits for sufficient displacement relative to ATR and the number of candles involved. Once the condition is satisfied, the structural low becomes the bullish origin and the highest price reached during the move becomes the destination.
If the bullish impulse continues creating new highs, the destination updates automatically. The Fibonacci retracement and selected entry level are recalculated with each new extension, keeping the setup aligned with the developing bullish move rather than an earlier high.
The entry becomes relevant when price retraces to the selected Fibonacci level. Instead of entering during the initial upward displacement, the setup waits for price to return into the active impulse. A shallower Fibonacci level requires a smaller pullback, while levels such as 61.8% or 78.6% require price to retrace deeper toward the bullish origin.
Once the bullish entry is triggered, the stop-loss is positioned below the structural origin with an ATR-based buffer. The distance between the entry and stop-loss defines the initial risk, which is then used to calculate the reward levels above the entry.
🔹Bearish Pullback Setup
A bearish setup follows the same process in the opposite direction. It begins from a confirmed structural high, and the indicator monitors the downside movement developing from that point. Once sufficient bearish displacement is detected, the structural high becomes the bearish origin and the lowest price reached during the move becomes the destination.
If price continues creating lower lows, the destination updates automatically. The Fibonacci retracement and selected entry level are recalculated with each extension, allowing the setup to remain aligned with the latest bearish expansion.
The entry becomes relevant when price retraces upward to the selected Fibonacci level. A shallow retracement reaches the entry earlier, while a deeper level requires price to move further back toward the bearish origin before the setup is triggered.
Once the bearish entry is triggered, the stop-loss is positioned above the structural origin with an ATR-based buffer. The distance between the entry and stop-loss defines the initial risk, and the reward levels are then projected below the entry according to the selected Reward / Risk setting.
🔹Pending Entry & Intrabar Resolution
Once a valid bullish or bearish setup becomes active, the selected Fibonacci level is treated as a pending entry. If the impulse extends again before price reaches that level, the destination changes and the Fibonacci entry is recalculated automatically. The pending entry therefore continues adapting to the active price move until it is triggered or reaches its expiration limit.
Historical candles can create an additional challenge when the same candle both extends the destination and touches a Fibonacci entry. A standard OHLC candle cannot always reveal whether the extension occurred before or after the retracement.
When the optional historical intrabar check is enabled, the indicator uses lower-timeframe data to inspect this sequence in greater detail. It can evaluate whether the previous entry was reached first, whether the destination extended before the retracement, or whether the newly calculated entry was reached after that extension.
This provides a more detailed reconstruction of historical entries than relying only on the high and low of the chart candle, particularly when extension and retracement occur within the same bar.
🔹Risk & Reward Management
After an entry is triggered, the indicator creates a reward-to-risk structure directly on the chart. The entry becomes the central reference point, while the structural stop-loss defines the initial risk distance.
Each reward level is calculated from that same risk distance. With a Reward / Risk setting of 2, for example, the indicator displays an intermediate 1R level and a final 2R target. Bullish reward levels are projected above the entry, while bearish reward levels are projected below it.
The indicator continues monitoring the active R/R structure after entry. A position can reach the stop-loss, reach the take-profit, expire after the maximum number of position bars, or close because of an opposite entry when that option is enabled. When historical price data cannot reliably determine the sequence between stop-loss and target events, the result can also be classified as Ambiguous.
The Fibonacci structure is intended to organize the relationship between displacement, retracement, entry, invalidation, and reward. The selected retracement depth defines where the pullback entry is placed, while broader price action and market context can be used separately when evaluating the significance of the setup.
🔶Input Parameters
🔹Entry Fibonacci Level
Selects the Fibonacci retracement level used as the active pullback entry. Available options are 23.6%, 38.2%, 50.0%, 61.8%, and 78.6%. Lower levels create shallower entry areas, while higher values require price to retrace deeper into the original displacement before the entry is triggered.
🔹Entry Expiration Bars
Defines how long the pending Fibonacci entry remains active after the latest extension of the move. If price does not reach the selected entry within the specified number of bars, the pending entry expires.
🔹Reward / Risk
Controls the final reward target relative to the distance between the entry and stop-loss. For example, a value of 2 places the final target at 2R, meaning twice the original risk distance from the entry.
🔹Stop-Loss ATR Threshold
Controls the ATR-based buffer added beyond the structural origin of the setup. Higher values place the stop-loss farther beyond the swing point, while lower values keep the stop closer to the original structure.
🔹Use Intrabar Historical Check
Enables lower-timeframe analysis for historical entry detection. This helps the indicator determine the sequence of events when a candle both extends the destination and reaches a Fibonacci entry level.
🔹Historical Intrabar Timeframe
Selects the lower timeframe used for historical intrabar analysis. Smaller timeframes provide more detailed information about the movement inside each chart candle when sufficient lower-timeframe data is available.
🔹Block New Same-Type Position While Open
Prevents the indicator from activating another position in the same direction while an existing position of that type is still active.
🔹Close Opposite Position On New Entry
Allows a newly triggered entry in the opposite direction to close the currently active position. When disabled, opposite setups can be handled independently according to the existing position logic.
🔹Delete Previous R/R
Controls whether the previous reward-to-risk visualization is removed when a new R/R setup is created. Enabling this option keeps the chart focused on the most recent trade structure.
🔹Position Expiration Bars
Defines the maximum number of bars an active R/R setup can remain unresolved. If neither the stop-loss nor the take-profit is reached during this period, the position is marked as expired.
🔶Summary
ICT Pullback Setup | Smart OTE Fibonacci Levels [RadixAlgo] combines market structure, directional displacement, Fibonacci retracement, OTE-style pullback entries, ATR-based stop-loss placement, and reward-to-risk analysis in one adaptive framework.
Instead of requiring traders to manually select two fixed swing points, the indicator identifies the active origin and destination of the move and continues updating the destination while price expands. This allows the Fibonacci retracement levels to remain connected to the current impulse as market structure develops.
The selected Fibonacci entry gives traders a structured way to monitor shallow or deep pullbacks, while the historical intrabar system helps improve the interpretation of situations where extension and entry occur inside the same candle.
After an entry is triggered, the built-in R/R visualization connects the setup with its structural stop-loss and potential reward levels, allowing traders to follow the entire process from displacement and retracement to entry, risk, and possible continuation.
The indicator can be used alongside ICT concepts, Smart Money Concepts, market structure analysis, liquidity, fair value gaps, order blocks, trend-following strategies, and price action trading. Rather than replacing trader judgment with a rigid signal system, it provides a visual framework for understanding how price moves from impulse to pullback and from pullback toward potential continuation.
⚠️Disclaimer
This indicator is designed for educational and analytical purposes only and should not be considered financial advice or a recommendation to enter any trade. Every signal should be evaluated by the trader based on their own market analysis, strategy, risk tolerance, and trading plan. The decision to use or ignore a signal always remains with the trader.
Not every signal will result in a profitable trade, and losing setups are a normal part of market participation. Historical performance, Fibonacci retracement behavior, OTE-style setups, and reward-to-risk projections do not guarantee future results. Traders should apply appropriate risk management and use the indicator as a supporting analytical tool rather than as an automatic decision-making system.

免責事項
これらの情報および投稿は、TradingViewが提供または承認する金融、投資、取引、またはその他の種類の助言もしくは推奨であることを意図したものではなく、またこれらに該当するものでもありません。詳細は利用規約をご覧ください。
免責事項
これらの情報および投稿は、TradingViewが提供または承認する金融、投資、取引、またはその他の種類の助言もしくは推奨であることを意図したものではなく、またこれらに該当するものでもありません。詳細は利用規約をご覧ください。