OPEN-SOURCE SCRIPT
AlgoSentry Opening Range Breakout [Non-Repaint]
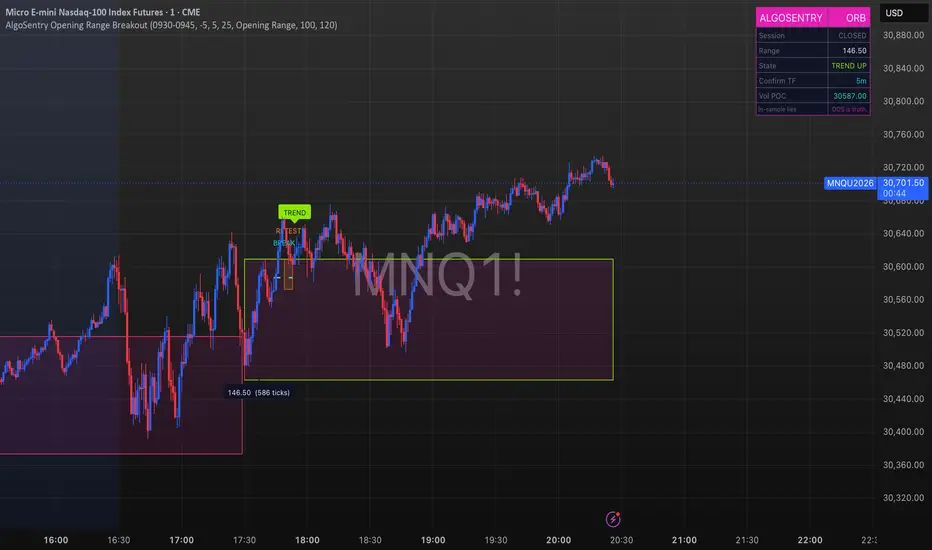
The Opening Range is the high and low of the first minutes of a session. This indicator maps that range and then tracks the classic Break -> Retest -> Trend sequence that opening-range traders watch — built non-repaint from the ground up.
How it works
Once your opening window closes, the range high and low freeze. From there the script tracks three events:
• Break — the first candle to CLOSE beyond the frozen range, confirmed on the timeframe you choose (chart, 5m, 10m, or 15m). Higher confirmation = fewer fakeouts, later signal.
• Retest — the first pullback that taps an enabled zone: the broken edge, a percent level inside the range, or the session volume Point of Control.
• Trend — the first re-close beyond the range after the retest, marking continuation.
Why non-repaint matters here
Most "breakout" tools look perfect on history because they quietly use future data or redraw as you scroll. This one does not:
• The range freezes at session close and never moves.
• The volume Point of Control is computed once, over a fixed time window — no visible-range tricks, so it never shifts when you scroll or zoom.
• Every signal is committed on bar close.
• Higher-timeframe confirmation is read only after the higher-timeframe candle has closed (lookahead off).
What you saw in real time is what stays on the chart.
Settings
• Opening range session and timezone (default 09:30-09:45, exchange time).
• Confirmation timeframe for the breakout.
• Three retest zones — broken edge, percent of range, and volume Point of Control — each can be toggled on or off.
• Volume POC window: the opening range itself, or the full trading day.
• A compact dashboard shows session state, range size, the live Break/Retest/Trend state, the confirmation timeframe, and the volume POC level.
Every parameter is an input, and every filter can be turned on or off, so you can adapt the tool to your own market and style. It is designed for index futures on intraday charts (1-5 minute), but works on any symbol — validate it on your own instrument and timeframe before relying on it.
A note on honesty
Opening-range breakout is a well-known, widely-published concept. This tool does not invent an edge or promise results — it gives you a clean, disciplined, non-repaint way to see the sequence and study how it actually behaves on your charts.
Educational and informational use only. This is not financial advice, and nothing here is a recommendation to buy or sell. Past or hypothetical behavior does not predict future results. Always test thoroughly before trading.
How it works
Once your opening window closes, the range high and low freeze. From there the script tracks three events:
• Break — the first candle to CLOSE beyond the frozen range, confirmed on the timeframe you choose (chart, 5m, 10m, or 15m). Higher confirmation = fewer fakeouts, later signal.
• Retest — the first pullback that taps an enabled zone: the broken edge, a percent level inside the range, or the session volume Point of Control.
• Trend — the first re-close beyond the range after the retest, marking continuation.
Why non-repaint matters here
Most "breakout" tools look perfect on history because they quietly use future data or redraw as you scroll. This one does not:
• The range freezes at session close and never moves.
• The volume Point of Control is computed once, over a fixed time window — no visible-range tricks, so it never shifts when you scroll or zoom.
• Every signal is committed on bar close.
• Higher-timeframe confirmation is read only after the higher-timeframe candle has closed (lookahead off).
What you saw in real time is what stays on the chart.
Settings
• Opening range session and timezone (default 09:30-09:45, exchange time).
• Confirmation timeframe for the breakout.
• Three retest zones — broken edge, percent of range, and volume Point of Control — each can be toggled on or off.
• Volume POC window: the opening range itself, or the full trading day.
• A compact dashboard shows session state, range size, the live Break/Retest/Trend state, the confirmation timeframe, and the volume POC level.
Every parameter is an input, and every filter can be turned on or off, so you can adapt the tool to your own market and style. It is designed for index futures on intraday charts (1-5 minute), but works on any symbol — validate it on your own instrument and timeframe before relying on it.
A note on honesty
Opening-range breakout is a well-known, widely-published concept. This tool does not invent an edge or promise results — it gives you a clean, disciplined, non-repaint way to see the sequence and study how it actually behaves on your charts.
Educational and informational use only. This is not financial advice, and nothing here is a recommendation to buy or sell. Past or hypothetical behavior does not predict future results. Always test thoroughly before trading.
オープンソーススクリプト
TradingViewの精神に則り、このスクリプトの作者はコードをオープンソースとして公開してくれました。トレーダーが内容を確認・検証できるようにという配慮です。作者に拍手を送りましょう!無料で利用できますが、コードの再公開はハウスルールに従う必要があります。

AlgoSentry · Quant Auditor
8-Test Robustness Methodology · We audit trading strategies before traders deploy them.
In-sample lies. Out-of-sample is the truth.
→ algosentry.com
8-Test Robustness Methodology · We audit trading strategies before traders deploy them.
In-sample lies. Out-of-sample is the truth.
→ algosentry.com
免責事項
これらの情報および投稿は、TradingViewが提供または承認する金融、投資、取引、またはその他の種類の助言もしくは推奨であることを意図したものではなく、またこれらに該当するものでもありません。詳細は利用規約をご覧ください。
オープンソーススクリプト
TradingViewの精神に則り、このスクリプトの作者はコードをオープンソースとして公開してくれました。トレーダーが内容を確認・検証できるようにという配慮です。作者に拍手を送りましょう!無料で利用できますが、コードの再公開はハウスルールに従う必要があります。
AlgoSentry · Quant Auditor
8-Test Robustness Methodology · We audit trading strategies before traders deploy them.
In-sample lies. Out-of-sample is the truth.
→ algosentry.com
8-Test Robustness Methodology · We audit trading strategies before traders deploy them.
In-sample lies. Out-of-sample is the truth.
→ algosentry.com
免責事項
これらの情報および投稿は、TradingViewが提供または承認する金融、投資、取引、またはその他の種類の助言もしくは推奨であることを意図したものではなく、またこれらに該当するものでもありません。詳細は利用規約をご覧ください。