Nambou Structure Radar: BOS & CHoCH with Multi-Timeframe Trend
Ever been sure the trend was up, only to realise price broke the last higher low two days ago? Market structure tells you which way the trend really points, but reading it by eye on every timeframe is slow and easy to get wrong. So I built a radar for it 📡
🎯 What it does
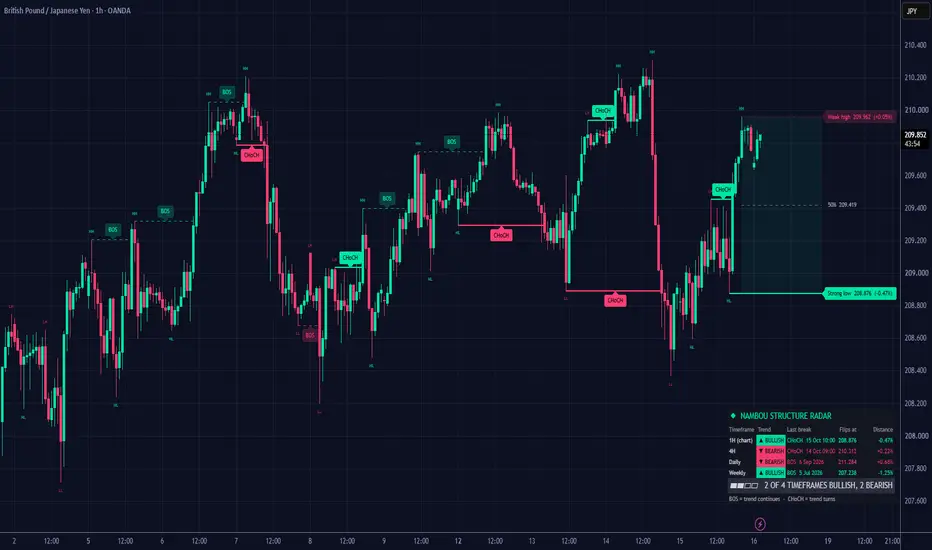
Structure Radar marks every swing high and low, then watches what price does with them. When price closes beyond the last swing in the direction of the trend, that's a break of structure (BOS): the trend continues. When it closes beyond the swing against the trend, that's a change of character (CHoCH): the trend has turned. It does this on your chart and, at the same time, on the three timeframes above it.
👀 What you see on the chart
🟢 Green is bullish and 🔴 red is bearish.
Swings are labelled HH, HL, LH and LL (higher high, higher low, lower high, lower low).
A BOS is a dashed line from the swing to the bar that broke it. A CHoCH is a solid line with a filled tag, so trend changes stand out at a glance.
The two live swings run past the last candle with their price and distance. The one that would flip the trend is the strong one (solid line); the other is the next break in the trend's direction (dotted line).
Between them, a faint zone shades the current range, with a dashed line at its middle.
⏫ The trend on four timeframes
The table shows the structure on your chart plus the three timeframes above it: 1H, 4H and Daily below one hour, up to Weekly, Monthly and 3 months on a daily chart. For each one: the trend, the last break (BOS or CHoCH) and when it happened, the level where the trend would flip, and how far price is from it. A line underneath sums it up, for example "2 of 4 timeframes bullish, 2 bearish". You can pick the timeframes yourself in the settings.
📋 Where the table goes
By default it sits at the top or the bottom of the chart, wherever the candles leave more room. If it lands on your candles, pick another position in the settings.
🔔 Alerts
Create an alert on the indicator with "Any alert() function call" and you get a message on every BOS and CHoCH on your chart, and when one of the higher timeframes flips its trend. Each kind can be switched off in the settings.
⚙️ Settings worth knowing
"Swing size" is how many bars on each side make a swing (5 by default). Bigger numbers give fewer, bigger swings and a slower trend.
"A swing is broken by a" close (default) or a wick.
The swing labels, the break lines, the live levels, the range shading, candle colouring by trend and the table each have their own switch.
⚠️ Worth knowing
A swing is only confirmed after the "Swing size" number of bars, so swing labels show up late. Breaks are judged on closed bars, alerts included, and the higher timeframes are read from their last closed bar, so nothing repaints.
A BOS or CHoCH describes what price did to a swing. It doesn't tell you what happens next, and trends flip back more often than you'd think.
This is a charting tool, not financial advice.
🎯 What it does
Structure Radar marks every swing high and low, then watches what price does with them. When price closes beyond the last swing in the direction of the trend, that's a break of structure (BOS): the trend continues. When it closes beyond the swing against the trend, that's a change of character (CHoCH): the trend has turned. It does this on your chart and, at the same time, on the three timeframes above it.
👀 What you see on the chart
🟢 Green is bullish and 🔴 red is bearish.
Swings are labelled HH, HL, LH and LL (higher high, higher low, lower high, lower low).
A BOS is a dashed line from the swing to the bar that broke it. A CHoCH is a solid line with a filled tag, so trend changes stand out at a glance.
The two live swings run past the last candle with their price and distance. The one that would flip the trend is the strong one (solid line); the other is the next break in the trend's direction (dotted line).
Between them, a faint zone shades the current range, with a dashed line at its middle.
⏫ The trend on four timeframes
The table shows the structure on your chart plus the three timeframes above it: 1H, 4H and Daily below one hour, up to Weekly, Monthly and 3 months on a daily chart. For each one: the trend, the last break (BOS or CHoCH) and when it happened, the level where the trend would flip, and how far price is from it. A line underneath sums it up, for example "2 of 4 timeframes bullish, 2 bearish". You can pick the timeframes yourself in the settings.
📋 Where the table goes
By default it sits at the top or the bottom of the chart, wherever the candles leave more room. If it lands on your candles, pick another position in the settings.
🔔 Alerts
Create an alert on the indicator with "Any alert() function call" and you get a message on every BOS and CHoCH on your chart, and when one of the higher timeframes flips its trend. Each kind can be switched off in the settings.
⚙️ Settings worth knowing
"Swing size" is how many bars on each side make a swing (5 by default). Bigger numbers give fewer, bigger swings and a slower trend.
"A swing is broken by a" close (default) or a wick.
The swing labels, the break lines, the live levels, the range shading, candle colouring by trend and the table each have their own switch.
⚠️ Worth knowing
A swing is only confirmed after the "Swing size" number of bars, so swing labels show up late. Breaks are judged on closed bars, alerts included, and the higher timeframes are read from their last closed bar, so nothing repaints.
A BOS or CHoCH describes what price did to a swing. It doesn't tell you what happens next, and trends flip back more often than you'd think.
This is a charting tool, not financial advice.

Trade smarter, not louder. Free signals 📈 lessons 🎓 market news 📰 👉 t.me/nambou_signals
免責事項
これらの情報および投稿は、TradingViewが提供または承認する金融、投資、取引、またはその他の種類の助言もしくは推奨であることを意図したものではなく、またこれらに該当するものでもありません。詳細は利用規約をご覧ください。
Trade smarter, not louder. Free signals 📈 lessons 🎓 market news 📰 👉 t.me/nambou_signals
免責事項
これらの情報および投稿は、TradingViewが提供または承認する金融、投資、取引、またはその他の種類の助言もしくは推奨であることを意図したものではなく、またこれらに該当するものでもありません。詳細は利用規約をご覧ください。