OPEN-SOURCE SCRIPT
更新済 Trendchange Zones Indicator | iSolani
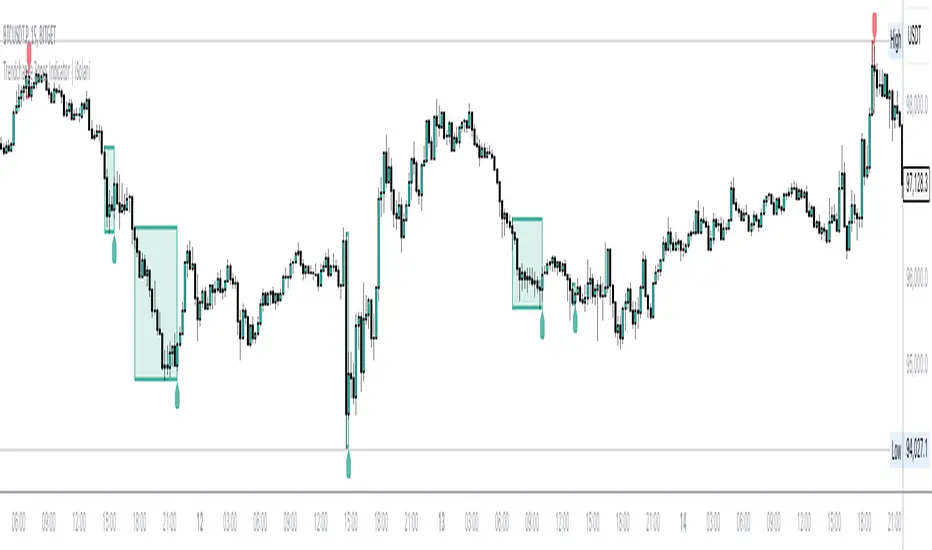
Spotting Reversals Before They Happen: The iSolani Trendshift System
Where RSI Meets Smart Volume Analysis - Your Visual Guide to Market Turns
Core Methodology
- RSI-Powered Zones
Identifies critical levels using:- 14-period RSI (default) with 70/30 thresholds
- Semi-transparent boxes marking overbought (red) and oversold (green) territories
- Zone persistence until RSI returns to neutral range
- Dynamic Level Tracking
Plots evolving support/resistance using:- Pivot highs/lows with 15-bar lookback (default)
- Auto-extending lines that adapt to new price extremes
- Volume-Confirmed Breakouts
Flags significant moves with:- 5/10 EMA volume oscillator
- 20% volume threshold (default) for confirmation
Technical Innovation
- Three-Layer Confirmation
Unique combination of:- Classic RSI extremes
- Price structure through pivot points
- Volume-fueled momentum shifts
- Adaptive Visualization
- Zones maintain historical context at 33% transparency
- Dynamic lines extend indefinitely until invalidated
- Discreet labels for breakout events
System Workflow
- Calculates RSI values in real-time
- Draws colored zones when RSI crosses 70/30
- Marks pivot points every 15 bars (default)
- Updates support/resistance lines on new pivots
- Triggers alerts when price breaks levels with volume confirmation
Standard Configuration
- RSI Settings: 14-period length
- Pivot Detection: 15-bar left/right lookback
- Visuals: 33% transparency zones with thin borders
- Volume Threshold: 20% oscillator difference
- Alerts: Breakout signals with "B" labels
This system transforms the classic RSI into a spatial analysis tool - not just showing when markets are overextended, but where they're likely to reverse. The dynamic lines act as moving barriers that adapt to market structure, while the volume filter ensures only high-conviction breaks get flagged. By layering momentum, price action, and volume dynamics, it creates a multi-spectrum view of potential trend changes.
リリースノート
Update!リリースノート
Update!リリースノート
Update!オープンソーススクリプト
TradingViewの精神に則り、このスクリプトの作者はコードをオープンソースとして公開してくれました。トレーダーが内容を確認・検証できるようにという配慮です。作者に拍手を送りましょう!無料で利用できますが、コードの再公開はハウスルールに従う必要があります。

免責事項
これらの情報および投稿は、TradingViewが提供または承認する金融、投資、取引、またはその他の種類の助言もしくは推奨であることを意図したものではなく、またこれらに該当するものでもありません。詳細は利用規約をご覧ください。
オープンソーススクリプト
TradingViewの精神に則り、このスクリプトの作者はコードをオープンソースとして公開してくれました。トレーダーが内容を確認・検証できるようにという配慮です。作者に拍手を送りましょう!無料で利用できますが、コードの再公開はハウスルールに従う必要があります。
免責事項
これらの情報および投稿は、TradingViewが提供または承認する金融、投資、取引、またはその他の種類の助言もしくは推奨であることを意図したものではなく、またこれらに該当するものでもありません。詳細は利用規約をご覧ください。