アップデート済
CHT 3 Consecutive Candles
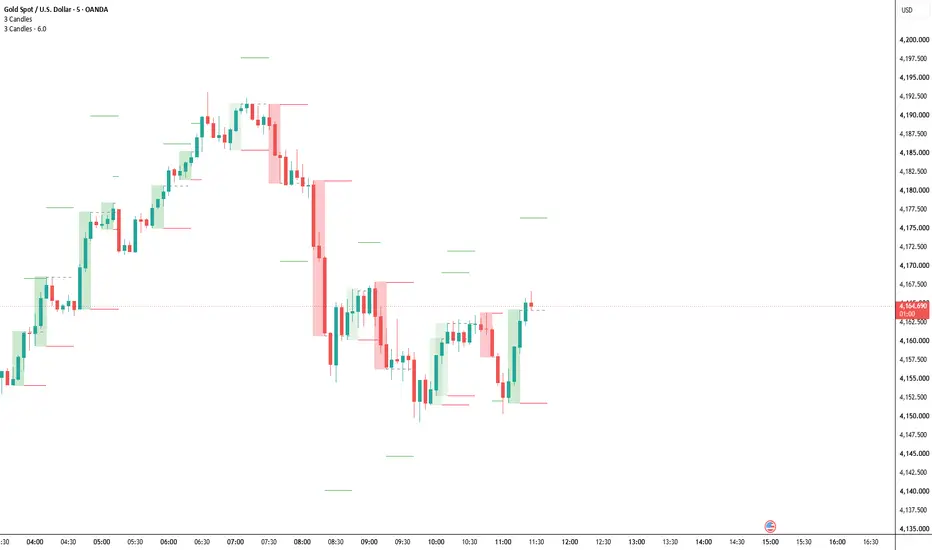
This indicator spots when a set number of bullish or bearish candles form in a row, and marks it directly on your chart with a coloured box and a label.
How it works
A candle counts as bullish if it closes above its open, and bearish if it closes below its open. When the chosen number of same-direction candles appear back to back (3 by default), the indicator draws a box around the whole run. Green means a bullish run and red means a bearish run. A label at the edge of the box shows the candle count and direction (3▲ or 3▼). A doji, where the open and close are equal, counts as neither and breaks the run.
How it works
A candle counts as bullish if it closes above its open, and bearish if it closes below its open. When the chosen number of same-direction candles appear back to back (3 by default), the indicator draws a box around the whole run. Green means a bullish run and red means a bearish run. A label at the edge of the box shows the candle count and direction (3▲ or 3▼). A doji, where the open and close are equal, counts as neither and breaks the run.
リリースノート
now the sl is at the top bottom of the box when before it would just be at the high/low of the 1st candle stick リリースノート
now there is a toggle option to see higher probiblity setups 
免責事項
これらの情報および投稿は、TradingViewが提供または承認する金融、投資、取引、またはその他の種類の助言もしくは推奨であることを意図したものではなく、またこれらに該当するものでもありません。詳細は利用規約をご覧ください。
免責事項
これらの情報および投稿は、TradingViewが提供または承認する金融、投資、取引、またはその他の種類の助言もしくは推奨であることを意図したものではなく、またこれらに該当するものでもありません。詳細は利用規約をご覧ください。