[davidev] RSI with Divergences
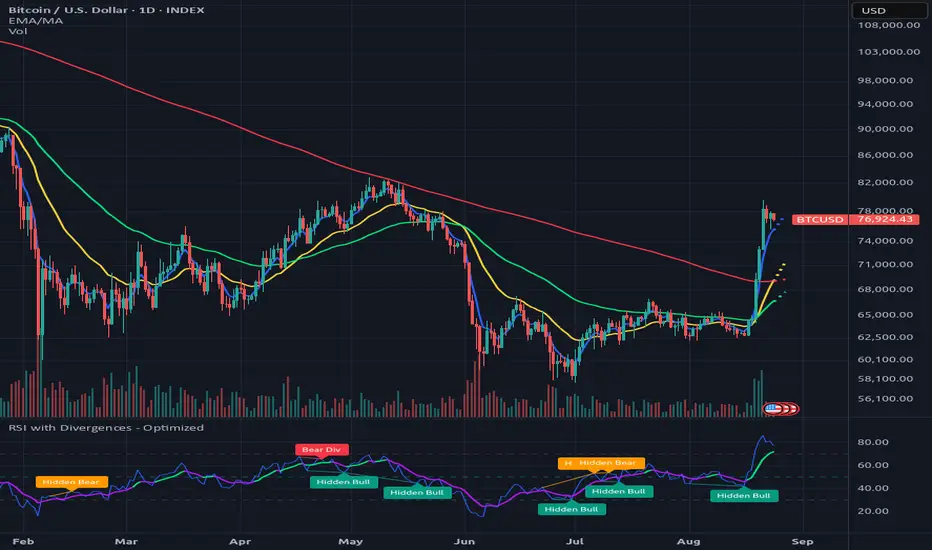
**RSI with Divergences - Optimized**
An enhanced Relative Strength Index (RSI) indicator designed to combine classic momentum analysis, automatic divergence detection, and an EMA-based momentum filter in a single oscillator.
The script automatically detects both **regular** and **hidden RSI divergences** by comparing confirmed RSI pivot highs/lows with the corresponding price structure.
### Features
* Standard configurable **RSI**
* Configurable **EMA of RSI**
* Dynamic EMA coloring based on RSI momentum
* Optional **DMI directional filter** for EMA coloring
* Automatic **Regular Bullish Divergence**
* Automatic **Regular Bearish Divergence**
* Automatic **Hidden Bullish Divergence**
* Automatic **Hidden Bearish Divergence**
* Configurable pivot sensitivity
* Optional divergence labels
* Custom colors and divergence line width
* Strict or inclusive high/low comparisons
* Automatic management of historical divergence drawings
* Built-in TradingView alerts for individual and combined divergence signals
### Divergence Logic
**Regular Bullish Divergence**
* Price forms a **lower low**
* RSI forms a **higher low**
This can indicate weakening bearish momentum and a potential bullish reversal.
**Regular Bearish Divergence**
* Price forms a **higher high**
* RSI forms a **lower high**
This can indicate weakening bullish momentum and a potential bearish reversal.
**Hidden Bullish Divergence**
* Price forms a **higher low**
* RSI forms a **lower low**
Hidden bullish divergences are generally associated with potential **bullish trend continuation**.
**Hidden Bearish Divergence**
* Price forms a **lower high**
* RSI forms a **higher high**
Hidden bearish divergences are generally associated with potential **bearish trend continuation**.
### EMA of RSI Momentum
The indicator also plots an EMA of the RSI to provide a smoother view of momentum.
By default, its color combines:
* The direction of the RSI EMA
* The relationship between **+DI and -DI**
The EMA is considered bullish when it is rising and +DI is greater than or equal to -DI, while bearish momentum is highlighted when the EMA is falling and -DI is greater than +DI.
The DMI filter can be disabled from the settings, in which case EMA coloring is determined exclusively by whether the RSI EMA is rising or falling.
### Pivot Confirmation
Divergences are calculated using confirmed RSI pivots.
The **Pivot Left** and **Pivot Right** settings control how many surrounding bars are required to validate a pivot.
Because a pivot requires future bars for confirmation, a divergence is only confirmed after the number of bars specified by **Pivot Right** has elapsed. The divergence is visually connected to the actual historical pivot points, while alerts trigger on the bar where the divergence becomes confirmed.
This avoids treating an unconfirmed pivot as a completed divergence.
### Strict Comparison
When **Strict HH/LL Comparison** is enabled, equal price or RSI highs/lows are not considered valid higher-high, lower-high, higher-low, or lower-low conditions.
Disabling it allows equal values to satisfy the relevant comparison.
### Alerts
The script includes alert conditions for:
* Regular Bullish RSI Divergence
* Hidden Bullish RSI Divergence
* Regular Bearish RSI Divergence
* Hidden Bearish RSI Divergence
* Any Bullish RSI Divergence
* Any Bearish RSI Divergence
* Any RSI Divergence
Alerts are generated when the corresponding pivot and divergence are **confirmed**, rather than on the historical pivot bar itself.
### Usage
RSI divergences can help identify changes in momentum, possible trend exhaustion, reversals, and continuation setups. They should not be treated as standalone buy or sell signals.
For better results, consider combining them with market structure, support and resistance, trend direction, volume, volatility, or other forms of confirmation.
The indicator is designed to provide a clean visual representation of RSI momentum while keeping divergence detection systematic, configurable, and easy to interpret.
An enhanced Relative Strength Index (RSI) indicator designed to combine classic momentum analysis, automatic divergence detection, and an EMA-based momentum filter in a single oscillator.
The script automatically detects both **regular** and **hidden RSI divergences** by comparing confirmed RSI pivot highs/lows with the corresponding price structure.
### Features
* Standard configurable **RSI**
* Configurable **EMA of RSI**
* Dynamic EMA coloring based on RSI momentum
* Optional **DMI directional filter** for EMA coloring
* Automatic **Regular Bullish Divergence**
* Automatic **Regular Bearish Divergence**
* Automatic **Hidden Bullish Divergence**
* Automatic **Hidden Bearish Divergence**
* Configurable pivot sensitivity
* Optional divergence labels
* Custom colors and divergence line width
* Strict or inclusive high/low comparisons
* Automatic management of historical divergence drawings
* Built-in TradingView alerts for individual and combined divergence signals
### Divergence Logic
**Regular Bullish Divergence**
* Price forms a **lower low**
* RSI forms a **higher low**
This can indicate weakening bearish momentum and a potential bullish reversal.
**Regular Bearish Divergence**
* Price forms a **higher high**
* RSI forms a **lower high**
This can indicate weakening bullish momentum and a potential bearish reversal.
**Hidden Bullish Divergence**
* Price forms a **higher low**
* RSI forms a **lower low**
Hidden bullish divergences are generally associated with potential **bullish trend continuation**.
**Hidden Bearish Divergence**
* Price forms a **lower high**
* RSI forms a **higher high**
Hidden bearish divergences are generally associated with potential **bearish trend continuation**.
### EMA of RSI Momentum
The indicator also plots an EMA of the RSI to provide a smoother view of momentum.
By default, its color combines:
* The direction of the RSI EMA
* The relationship between **+DI and -DI**
The EMA is considered bullish when it is rising and +DI is greater than or equal to -DI, while bearish momentum is highlighted when the EMA is falling and -DI is greater than +DI.
The DMI filter can be disabled from the settings, in which case EMA coloring is determined exclusively by whether the RSI EMA is rising or falling.
### Pivot Confirmation
Divergences are calculated using confirmed RSI pivots.
The **Pivot Left** and **Pivot Right** settings control how many surrounding bars are required to validate a pivot.
Because a pivot requires future bars for confirmation, a divergence is only confirmed after the number of bars specified by **Pivot Right** has elapsed. The divergence is visually connected to the actual historical pivot points, while alerts trigger on the bar where the divergence becomes confirmed.
This avoids treating an unconfirmed pivot as a completed divergence.
### Strict Comparison
When **Strict HH/LL Comparison** is enabled, equal price or RSI highs/lows are not considered valid higher-high, lower-high, higher-low, or lower-low conditions.
Disabling it allows equal values to satisfy the relevant comparison.
### Alerts
The script includes alert conditions for:
* Regular Bullish RSI Divergence
* Hidden Bullish RSI Divergence
* Regular Bearish RSI Divergence
* Hidden Bearish RSI Divergence
* Any Bullish RSI Divergence
* Any Bearish RSI Divergence
* Any RSI Divergence
Alerts are generated when the corresponding pivot and divergence are **confirmed**, rather than on the historical pivot bar itself.
### Usage
RSI divergences can help identify changes in momentum, possible trend exhaustion, reversals, and continuation setups. They should not be treated as standalone buy or sell signals.
For better results, consider combining them with market structure, support and resistance, trend direction, volume, volatility, or other forms of confirmation.
The indicator is designed to provide a clean visual representation of RSI momentum while keeping divergence detection systematic, configurable, and easy to interpret.

免責事項
これらの情報および投稿は、TradingViewが提供または承認する金融、投資、取引、またはその他の種類の助言もしくは推奨であることを意図したものではなく、またこれらに該当するものでもありません。詳細は利用規約をご覧ください。
免責事項
これらの情報および投稿は、TradingViewが提供または承認する金融、投資、取引、またはその他の種類の助言もしくは推奨であることを意図したものではなく、またこれらに該当するものでもありません。詳細は利用規約をご覧ください。