Mongoose Yield Spread Dashboard v5 – Labeled, Alerted, Readable
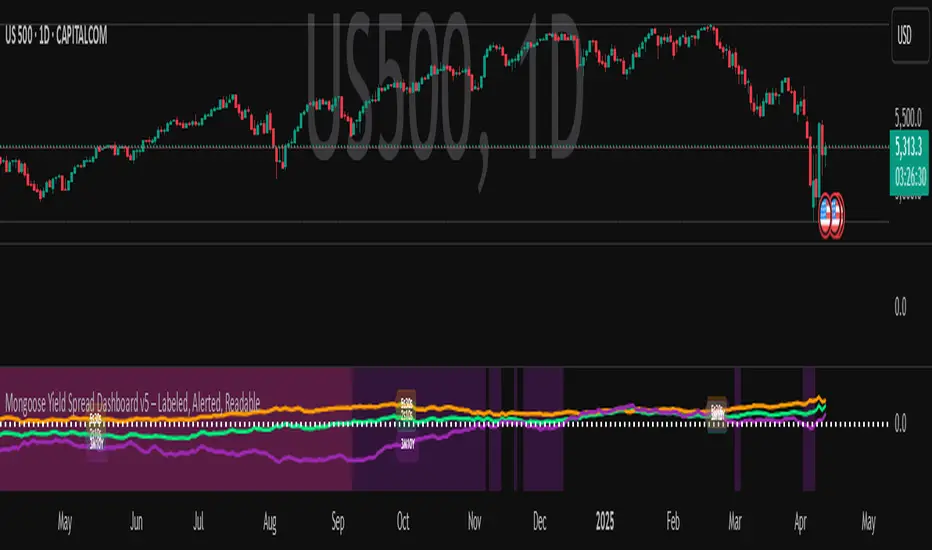
CurveGuard: Mongoose Edition
Track the macro tide before it turns.
This tool visualizes the three most-watched U.S. Treasury yield curve spreads:
2s10s (10Y - 2Y)
5s30s (30Y - 5Y)
3M10Y (10Y - 3M)
Each spread is plotted with dynamic color logic, inversion alerts, and floating labels. Background shading highlights historical inversion zones to help spot macro regime shifts in real time.
✅ Alert-ready
✅ Dark mode optimized
✅ Floating labels
✅ Clean layout for fast macro insight
📌 For educational and informational purposes only.
This script does not provide financial advice or trade recommendations.
Track the macro tide before it turns.
This tool visualizes the three most-watched U.S. Treasury yield curve spreads:
2s10s (10Y - 2Y)
5s30s (30Y - 5Y)
3M10Y (10Y - 3M)
Each spread is plotted with dynamic color logic, inversion alerts, and floating labels. Background shading highlights historical inversion zones to help spot macro regime shifts in real time.
✅ Alert-ready
✅ Dark mode optimized
✅ Floating labels
✅ Clean layout for fast macro insight
📌 For educational and informational purposes only.
This script does not provide financial advice or trade recommendations.

免責事項
これらの情報および投稿は、TradingViewが提供または承認する金融、投資、取引、またはその他の種類の助言もしくは推奨であることを意図したものではなく、またこれらに該当するものでもありません。詳細は利用規約をご覧ください。
免責事項
これらの情報および投稿は、TradingViewが提供または承認する金融、投資、取引、またはその他の種類の助言もしくは推奨であることを意図したものではなく、またこれらに該当するものでもありません。詳細は利用規約をご覧ください。