アップデート済
Seasonality
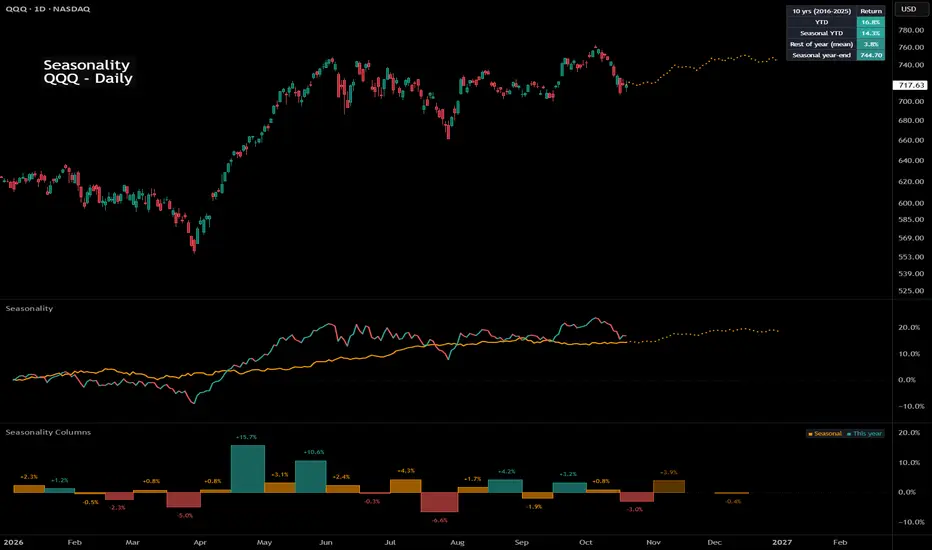
This is my attempt to bring an open source Seasonality indicator to TradingView.
There are still outstanding issues I couldn't figure out, so I am hoping some more seasoned Pine Script coders can take the lead from here.
What is Seasonality: https://www.investopedia.com/terms/s/seasonality.asp
How to Use
Known Issues
Areas for Improvement
There are still outstanding issues I couldn't figure out, so I am hoping some more seasoned Pine Script coders can take the lead from here.
What is Seasonality: https://www.investopedia.com/terms/s/seasonality.asp
How to Use
- The indicator plots the avg % change per bar for all complete years, up to 20 years back.
- It will only show in the daily resolution.
- For charts with more data, you need to scroll back a bit to get the line to display.
- Use Offset Adjust in the menu for charts that do not align perfectly to the start of the year.
- Use Smoothing in the menu to apply an EMA to the line.
- The panel shows YTD % gain, 5-day rolling seasonality, and 20-day rolling seasonality.
Known Issues
- Does not work for tickers with over 10,000 bars of data.
- Some tickers do not align correctly.
- Only works with tickers that have ~252 bars a year.
Areas for Improvement
- Figure out a way to use barssince() to get the precise amount of bars for each year. This will make the seasonality calculation and automatic offset more accurate.
- Have an option for calendar week, month, and year seasonality.
リリースノート
Cleaned up the script.リリースノート
Cleaned up the code some more so it is easier to read.リリースノート
Major update: rewritten from the ground up in Pine Script v6.WHAT'S NEW
• Calendar alignment: each year is placed on a common 365-day calendar by bar date, so stocks, ETFs, 24/7 crypto, forex and futures all line up correctly. The old "Offset Adjust" input is gone; nothing needs adjusting.
• Composite of the last N complete years (default 10), using a compounded mean (so one huge year can't dominate) or the median. Incomplete years (late start, early end, data gaps, thin data) are skipped automatically.
• Own pane: the orange seasonal composite and this year's YTD return on the same % axis, with the rest of the year dotted to Dec 31.
• Price chart: the seasonal path runs from today's close to Dec 31. Or start it from last year's close to compare this year with the seasonal path.
• Panel: YTD, Seasonal YTD, Rest of year (the average of past years from today to Dec 31) and the Seasonal year-end price. Hover any cell for details, including each year's value and the best and worst year.
• Optional US presidential-cycle filter, smoothing, and "Show on past years" to see how the pattern held up out of sample.
• Works on daily, weekly and monthly charts.
COMPANION: SEASONALITY COLUMNS
A new companion indicator, Seasonality Columns, shows the same composite as monthly (or weekly or quarterly) columns: what each period typically did (orange) next to what it did this year (green/red).
NOTE
Settings have changed. If the indicator is already on your chart, remove it and add it again.
This shows a historical tendency based on a small number of years. It is not a forecast or a price target.

免責事項
これらの情報および投稿は、TradingViewが提供または承認する金融、投資、取引、またはその他の種類の助言もしくは推奨であることを意図したものではなく、またこれらに該当するものでもありません。詳細は利用規約をご覧ください。
免責事項
これらの情報および投稿は、TradingViewが提供または承認する金融、投資、取引、またはその他の種類の助言もしくは推奨であることを意図したものではなく、またこれらに該当するものでもありません。詳細は利用規約をご覧ください。