OPEN-SOURCE SCRIPT
Dynamic Pivot Structure [DPS]
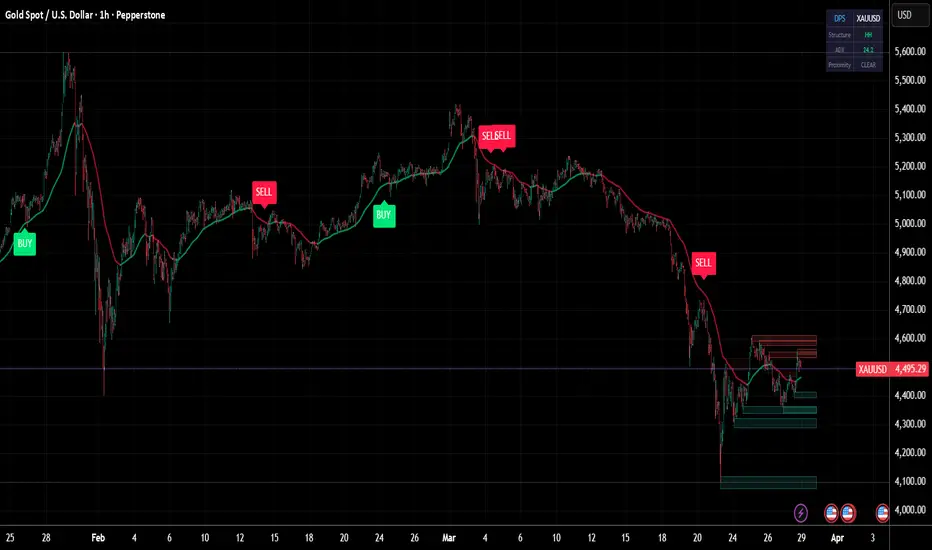
Dynamic Pivot Structure (DPS) is a price structure analysis tool that automatically detects pivot points, classifies market structure (HH, HL, LH, LL), and generates dynamic support/resistance zones with mitigation tracking.

**Mathematical Foundation:**
The indicator uses the standard pivot point detection algorithm with configurable left and right bar confirmations. A pivot high is confirmed when the high of a bar is greater than the highs of all N bars to its left and N bars to its right. Similarly for pivot lows. This provides mathematically validated local extremes rather than arbitrary level selection.
Market structure classification follows the Dow Theory framework: Higher Highs (HH) and Higher Lows (HL) define uptrends; Lower Highs (LH) and Lower Lows (LL) define downtrends. The indicator tracks consecutive pivot sequences and labels each new pivot with its structural classification.

Support and resistance zones are generated around each pivot using the Average True Range (ATR) for zone width. This creates proportional zones that automatically adjust to the instrument's volatility. The indicator tracks zone mitigation — when price penetrates a zone, it is marked as mitigated and visually faded.
**Signal Logic:**
Buy signals fire when price is near an unmitigated support zone, above the trend EMA, with RSI below 40 or bullish structure (HH/HL), and ADX confirming a trending environment. Sell signals fire near resistance with bearish conditions.

**Features:**
- Automatic pivot high/low detection with adjustable sensitivity
- Market structure classification (HH, HL, LH, LL)
- Dynamic ATR-based support and resistance zones
- Zone mitigation tracking with visual feedback
- ADX trend strength filter
- Trend EMA overlay
- Dashboard showing structure type, ADX, and proximity status
**Mathematical Foundation:**
The indicator uses the standard pivot point detection algorithm with configurable left and right bar confirmations. A pivot high is confirmed when the high of a bar is greater than the highs of all N bars to its left and N bars to its right. Similarly for pivot lows. This provides mathematically validated local extremes rather than arbitrary level selection.
Market structure classification follows the Dow Theory framework: Higher Highs (HH) and Higher Lows (HL) define uptrends; Lower Highs (LH) and Lower Lows (LL) define downtrends. The indicator tracks consecutive pivot sequences and labels each new pivot with its structural classification.
Support and resistance zones are generated around each pivot using the Average True Range (ATR) for zone width. This creates proportional zones that automatically adjust to the instrument's volatility. The indicator tracks zone mitigation — when price penetrates a zone, it is marked as mitigated and visually faded.
**Signal Logic:**
Buy signals fire when price is near an unmitigated support zone, above the trend EMA, with RSI below 40 or bullish structure (HH/HL), and ADX confirming a trending environment. Sell signals fire near resistance with bearish conditions.
**Features:**
- Automatic pivot high/low detection with adjustable sensitivity
- Market structure classification (HH, HL, LH, LL)
- Dynamic ATR-based support and resistance zones
- Zone mitigation tracking with visual feedback
- ADX trend strength filter
- Trend EMA overlay
- Dashboard showing structure type, ADX, and proximity status
オープンソーススクリプト
TradingViewの精神に則り、このスクリプトの作者はコードをオープンソースとして公開してくれました。トレーダーが内容を確認・検証できるようにという配慮です。作者に拍手を送りましょう!無料で利用できますが、コードの再公開はハウスルールに従う必要があります。

免責事項
これらの情報および投稿は、TradingViewが提供または承認する金融、投資、取引、またはその他の種類の助言もしくは推奨であることを意図したものではなく、またこれらに該当するものでもありません。詳細は利用規約をご覧ください。
オープンソーススクリプト
TradingViewの精神に則り、このスクリプトの作者はコードをオープンソースとして公開してくれました。トレーダーが内容を確認・検証できるようにという配慮です。作者に拍手を送りましょう!無料で利用できますが、コードの再公開はハウスルールに従う必要があります。
免責事項
これらの情報および投稿は、TradingViewが提供または承認する金融、投資、取引、またはその他の種類の助言もしくは推奨であることを意図したものではなく、またこれらに該当するものでもありません。詳細は利用規約をご覧ください。